REACT CHARTING SDK + AI AGENTS

Ship editable, AI-native charts in your product

Ship editable, AI-native charts in your product

Add polished charts, user-friendly editing and built-in storytelling tools to your product. Ship quickly with one maintained SDK, without building and maintaining the entire charting experience yourself.

Agents

# add graphy's skills to your agent
npx skills add graphysdk/skills
# then just ask
Chart revenue.csv by quarter, flag the Q4 jump.

developers

npm install @graphysdk/react

Free for non-commercial use. Contact us for commercial licensing.

Sankey chart showing Asia-Pacific market share falling while the Americas nearly doubles, styled like a consulting report.
Apple Health-style bar chart with a highlighted data callout.
Retro gaming-themed chart inspired by Nintendo 64 graphics.
Bar chart with company logos embedded in the bars, styled like an a16z report.
Comparison bar chart styled like Lenny’s Newsletter.
Minimal comparison chart using a Los Angeles Rams-inspired color palette.
House-price line chart styled like the Financial Times.
Hand-drawn notebook-style data visualization.
Stacked bar chart rendered with Graphy’s default theme.
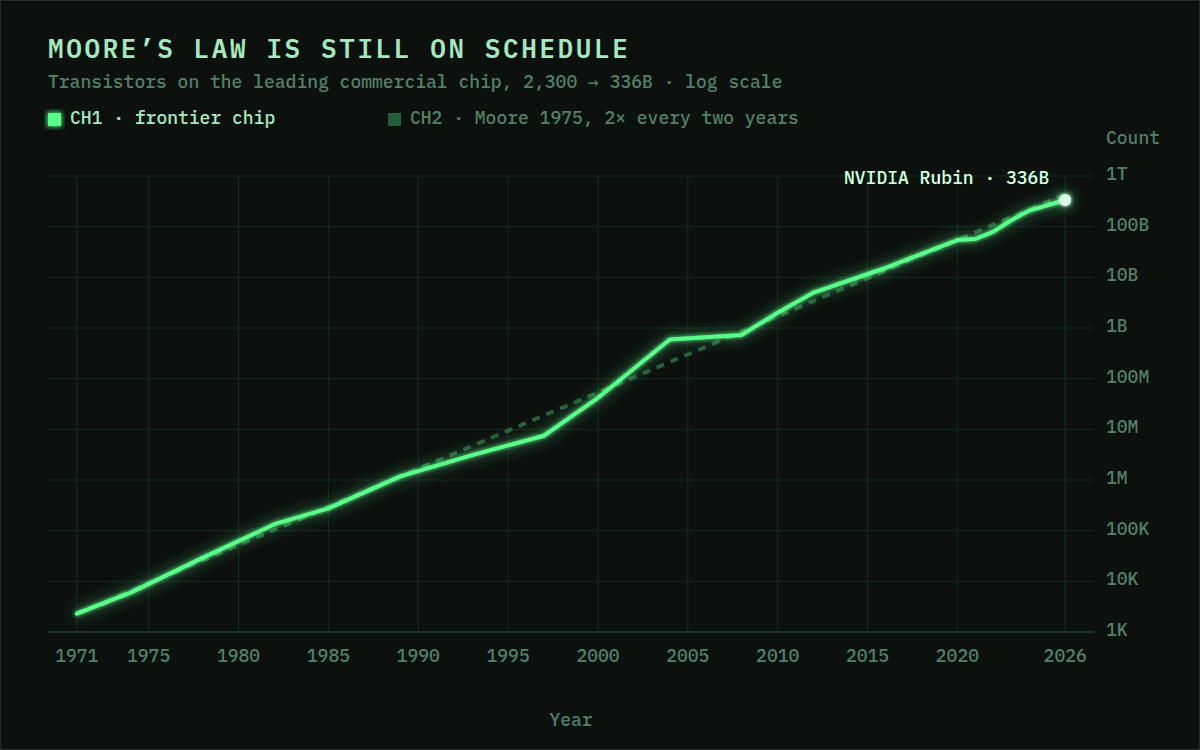
Line chart styled like an old computer terminal.
“Sankey chart in McKinsey style”
Made with Graphy
Browse
Sankey chart showing Asia-Pacific market share falling while the Americas nearly doubles, styled like a consulting report.
Apple Health-style bar chart with a highlighted data callout.
Retro gaming-themed chart inspired by Nintendo 64 graphics.
Bar chart with company logos embedded in the bars, styled like an a16z report.
Comparison bar chart styled like Lenny’s Newsletter.
Minimal comparison chart using a Los Angeles Rams-inspired color palette.
House-price line chart styled like the Financial Times.
Hand-drawn notebook-style data visualization.
Stacked bar chart rendered with Graphy’s default theme.
Line chart styled like an old computer terminal.
“Sankey chart in McKinsey style”
Made with Graphy
Browse

Turning data into stories at…

Loved by teams at

A charting SDK, editor, and AI workflow in one stack

Render production-ready charts, give users editing and storytelling tools, and add AI-assisted creation, without stitching together separate libraries, controls, and model pipelines.

Graphy editor showing customer growth rising from 1.1k in January to 1.5k in May 2024, with editing, theme, and annotation controls.

Charting SDK

A React charting SDK with editing built in.

Render expressive, responsive charts and let users change data, chart type, labels, styling, and annotations, without building a separate editor.
expressive charting engine

expressive charting engine

Annotation layer

Annotation layer

custom Theming

custom Theming

Built-In Editing experience

Built-In Editing experience

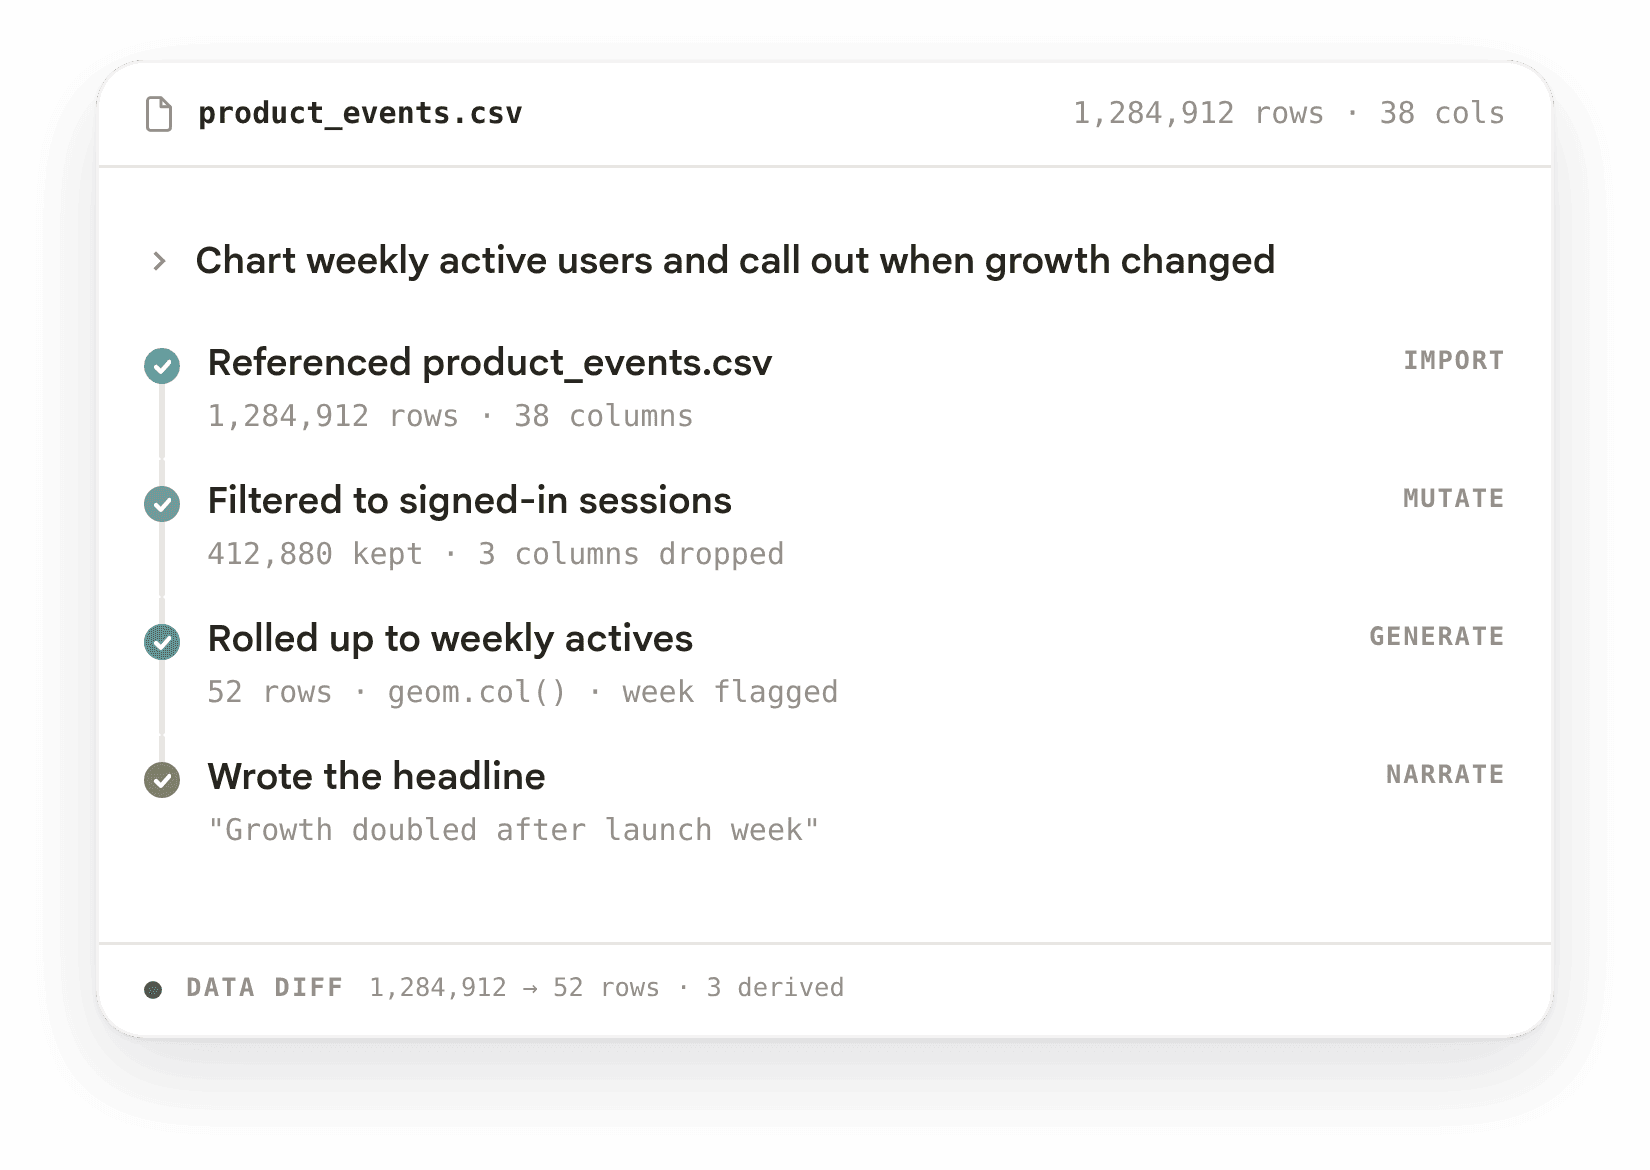
Graphy Agents workflow filtering product events, calculating weekly active users, and generating a narrative insight.

Graphy agents

NEW

Agents optimized for data transformation.

Turn messy data and prompts into polished visualizations and clear data stories, with insights called out automatically.

Fast chart rendering

Fast chart rendering

Prompt-Driven editing

Prompt-Driven editing

Token efficient

Token efficient

deterministic output

deterministic output

Built-in Chart validation

Built-in Chart validation

From raw data or a prompt to an editable chart.

Your existing charting library can render a chart. Graphy turns prompts and datasets into the right visualisation, adapts it to the task and helps users explain what matters.

As software becomes conversational, people expect to move from a question or dataset to a clear, editable visual answer. Graphy is the charting layer for that shift: expressive enough for the AI era, deterministic enough for production.

Polished charts from a prompt

On-brand, accurate, fast, and token efficient.

20%40%60%0%AI MESSAGES PER HYBRID TICKETIn 2 out of 3 tickets, the AI never speaksIt triages and hands to a human behind the scenes — customers only hear from people.65.8%0 AI messages21.3%1 AI message7.0%2 AI messages5.2%3–5 AI messages0.7%6+ AI messages
brand-deck.png
tickets.csv48k rows × 9brand-deck.png
2.0s · 81 tokens · one spec

Polished charts from a prompt

On-brand, accurate, fast, and token efficient.

20%40%60%0%AI MESSAGES PER HYBRID TICKETIn 2 out of 3 tickets, the AI never speaksIt triages and hands to a human behind the scenes — customers only hear from people.65.8%0 AI messages21.3%1 AI message7.0%2 AI messages5.2%3–5 AI messages0.7%6+ AI messages
brand-deck.png
tickets.csv48k rows × 9brand-deck.png
2.0s · 81 tokens · one spec

Polished charts from a prompt

On-brand, accurate, fast, and token efficient.

20%40%60%0%AI MESSAGES PER HYBRID TICKETIn 2 out of 3 tickets, the AI never speaksIt triages and hands to a human behind the scenes — customers only hear from people.65.8%0 AI messages21.3%1 AI message7.0%2 AI messages5.2%3–5 AI messages0.7%6+ AI messages
brand-deck.png
tickets.csv48k rows × 9brand-deck.png
2.0s · 81 tokens · one spec

Polished charts from a prompt

On-brand, accurate, fast, and token efficient.

20%40%60%0%AI MESSAGES PER HYBRID TICKETIn 2 out of 3 tickets, the AI never speaksIt triages and hands to a human behind the scenes — customers only hear from people.65.8%0 AI messages21.3%1 AI message7.0%2 AI messages5.2%3–5 AI messages0.7%6+ AI messages
brand-deck.png
tickets.csv48k rows × 9brand-deck.png
2.0s · 81 tokens · one spec

Polished charts from a prompt

On-brand, accurate, fast, and token efficient.

20%40%60%0%AI MESSAGES PER HYBRID TICKETIn 2 out of 3 tickets, the AI never speaksIt triages and hands to a human behind the scenes — customers only hear from people.65.8%0 AI messages21.3%1 AI message7.0%2 AI messages5.2%3–5 AI messages0.7%6+ AI messages
brand-deck.png
tickets.csv48k rows × 9brand-deck.png
2.0s · 81 tokens · one spec

FEATURED STORY · GAMMA

FEATURED STORY · GAMMA

How Gamma replaced two years of in-house
charting work with Graphy.

How Gamma replaced two years of in-house charting work with Graphy.

“After 2+ years building charts in-house, we switched to Graphy's SDK and Agents and never looked back. It’s the best library for editable graphs; polished, opinionated in the right ways, and gives users the tools to tell a clear story, not just display numbers.”

Jon Noronha, Co-founder and CPO at Gamma

Jon Noronha, Co-founder and CPO at Gamma

Jon Noronha, Co-founder and CPO at Gamma

build vs buy

Build your product, not a charting stack

Graphy handles the rendering engine, editor UX, annotations, themes, responsive behavior, and chart-specific edge cases. Your team keeps control of the product experience, without inheriting a charting platform to maintain.

Graphy handles the rendering engine, editor UX, annotations, themes, responsive behavior, and chart-specific edge cases. Your team keeps control of the product experience, without inheriting a charting platform to maintain.

What your product needs
Highcharts
Charting library + LLM
Graphy
Expressive, on-brand output
Chart-specific UX and edge cases maintained for you
Create and refine charts with natural language
Reliable transformations after the prompt
Token-efficient agent operations
Editable, story-ready output for end users
One path from raw data to an editable visual story

faq

faq

Frequently asked questions

Need answers to something we haven't covered? Get in touch.

Need answers to something we haven’t covered? Get in touch.

What is Graphy?

Graphy is a React charting SDK for embedding editable, on-brand data visualizations in software products. It is fully typed for TypeScript and includes rendering, end-user editing, annotations, and theming. Optional AI agents transform data and natural-language instructions into chart specifications, which the SDK renders deterministically.

How is Graphy different from a charting library?

Traditional charting libraries render a chart specification. Your team still has to build the editor, annotation layer, theming controls, AI workflow, and product-specific UX around them. Graphy provides those pieces as one system, while keeping rendering deterministic and the product experience under your control.

Can users edit charts made with Graphy?

Yes. Graphy’s built-in editor lets users change the data, chart type, layout, titles, labels, and styling, with guardrails that keep every chart clear and on-brand.

What are Graphy Agents?

Graphy Agents turn natural-language requests and raw data into accurate, structured chart specifications for the Graphy SDK. They can transform data, select charts, and add annotations and narrative. The Agents are optional: you can use the SDK independently. Deterministic rendering ensures the same specification and data always produce the same chart.

How do I get started?

Install the SDK and follow the quickstart to render your first chart. Graphy is free for non-commercial use. For use in a commercial product or project, contact the Graphy team to arrange a commercial licence.

How do commercial licences work?

Graphy is free for non-commercial use. A commercial licence is required when Graphy is used in a commercial product or project, including a customer-facing production environment. Contact us to discuss your product, expected usage, support requirements, and the right licence for your team.

Can I evaluate Graphy before licensing it?

Yes,Graphy is free for non-commercial use and evaluation. A commercial licence is required before using Graphy in a commercial product or project.

From the team behind Graphy.app, loved by more than 500,000 data storytellers.

  • Cindy Ibanez

    Global Head of Marketing at Wynwood House

    My team were in love! They were like, oh my God, what is this, this is the future!

  • Joe Edwards

    Senior Growth Marketing Manager at Venafi

    Most other data tools are passive and leave it up to the stakeholders to interpret the numbers

    Graphy helps you create stunning charts from disparate sources with the context and commentary your stakeholders need.

  • Stan Massueras

    General Manager at Lattice

    Great ideas are only impactful when communicated clearly.

    Graphy enabled us to transform data into compelling stories, and those stories into meaningful action.

  • Ryan Hoover

    Founder of Product Hunt

    I’d rather eat cardboard than create another pivot table. Thanks, Graphy (I don’t like cardboard)

  • Nick Lafferty

    Founder at Early Exit Club

    Graphy is the first tool I use when I'm looking to quickly create stunning visuals for my newsletter, social feeds, and my consulting business. I'm not stuck using Google Sheet's terrible default graphs anymore!

  • Liam Shalon

    Director of Research and Development at Level Ventures

    Most of the BI/internal tools we have for generating reports suck so bad that it’s embarrassing. Graphy is one of the few tools in the space for visualizing data that ‘just works’.

  • Joe Tyndall

    Head of Finance at Seedcamp

    Few things get me as excited as beautiful charts do. Graphy has transformed the way we work with data for both internal and external content.

    Effortless dashboards all in one place, and the AI features mean we can now produce them rapidly, and keep them updated live.

  • Neil Gandhi

    Founder of Send.co

    Graphy creates all my external facing charts.

    AI does all the heavy work, and it’s drop dead gorgeous

  • Michael Cockburn

    Founder of Desana

    It was a complete game changer when Graphy started to allow me to prompt it for insights, fine tune them, and make beautiful visualizations out the other side.

    Feels like the future of storytelling in business.

  • Jakob Knutzen

    CEO & Co-Founder at Butter

    Graphy allows me to make beautiful, super customized charts. This makes my communications of numbers to both investors and team much clearer.

    Plus it's just fun to use 😊

  • Guillermo Rauch

    CEO at Vercel

    Stunning product.

  • David Jarvis

    Founder/CEO at Griffin

    I’ve been waiting for something like Graphy for nearly twenty years.

    Beautiful, insightful, and dead easy to use. I’m obsessed.

  • Jon Noronha

    Co-Founder and CPO at Gamma

    Graphy is the best library for user-friendly editable graphs.

    Visual polish, opinionated in the right ways, clean and simple display of information, nice interactivity Just the right amount of information to feel rigorous without being overwhelming for the person reading the graph.

From the team behind Graphy.app, loved by more than 500,000 data storytellers.

  • Cindy Ibanez

    Global Head of Marketing at Wynwood House

    My team were in love! They were like, oh my God, what is this, this is the future!

  • Joe Edwards

    Senior Growth Marketing Manager at Venafi

    Most other data tools are passive and leave it up to the stakeholders to interpret the numbers

    Graphy helps you create stunning charts from disparate sources with the context and commentary your stakeholders need.

  • Stan Massueras

    General Manager at Lattice

    Great ideas are only impactful when communicated clearly.

    Graphy enabled us to transform data into compelling stories, and those stories into meaningful action.

  • Ryan Hoover

    Founder of Product Hunt

    I’d rather eat cardboard than create another pivot table. Thanks, Graphy (I don’t like cardboard)

  • Nick Lafferty

    Founder at Early Exit Club

    Graphy is the first tool I use when I'm looking to quickly create stunning visuals for my newsletter, social feeds, and my consulting business. I'm not stuck using Google Sheet's terrible default graphs anymore!

  • Liam Shalon

    Director of Research and Development at Level Ventures

    Most of the BI/internal tools we have for generating reports suck so bad that it’s embarrassing. Graphy is one of the few tools in the space for visualizing data that ‘just works’.

  • Joe Tyndall

    Head of Finance at Seedcamp

    Few things get me as excited as beautiful charts do. Graphy has transformed the way we work with data for both internal and external content.

    Effortless dashboards all in one place, and the AI features mean we can now produce them rapidly, and keep them updated live.

  • Neil Gandhi

    Founder of Send.co

    Graphy creates all my external facing charts.

    AI does all the heavy work, and it’s drop dead gorgeous

  • Michael Cockburn

    Founder of Desana

    It was a complete game changer when Graphy started to allow me to prompt it for insights, fine tune them, and make beautiful visualizations out the other side.

    Feels like the future of storytelling in business.

  • Jakob Knutzen

    CEO & Co-Founder at Butter

    Graphy allows me to make beautiful, super customized charts. This makes my communications of numbers to both investors and team much clearer.

    Plus it's just fun to use 😊

  • Guillermo Rauch

    CEO at Vercel

    Stunning product.

  • David Jarvis

    Founder/CEO at Griffin

    I’ve been waiting for something like Graphy for nearly twenty years.

    Beautiful, insightful, and dead easy to use. I’m obsessed.

  • Jon Noronha

    Co-Founder and CPO at Gamma

    Graphy is the best library for user-friendly editable graphs.

    Visual polish, opinionated in the right ways, clean and simple display of information, nice interactivity Just the right amount of information to feel rigorous without being overwhelming for the person reading the graph.

From the team behind Graphy.app, loved by more than 500,000 data storytellers.

  • Cindy Ibanez

    Global Head of Marketing at Wynwood House

    My team were in love! They were like, oh my God, what is this, this is the future!

  • Joe Edwards

    Senior Growth Marketing Manager at Venafi

    Most other data tools are passive and leave it up to the stakeholders to interpret the numbers

    Graphy helps you create stunning charts from disparate sources with the context and commentary your stakeholders need.

  • Stan Massueras

    General Manager at Lattice

    Great ideas are only impactful when communicated clearly.

    Graphy enabled us to transform data into compelling stories, and those stories into meaningful action.

  • Ryan Hoover

    Founder of Product Hunt

    I’d rather eat cardboard than create another pivot table. Thanks, Graphy (I don’t like cardboard)

  • Nick Lafferty

    Founder at Early Exit Club

    Graphy is the first tool I use when I'm looking to quickly create stunning visuals for my newsletter, social feeds, and my consulting business. I'm not stuck using Google Sheet's terrible default graphs anymore!

  • Liam Shalon

    Director of Research and Development at Level Ventures

    Most of the BI/internal tools we have for generating reports suck so bad that it’s embarrassing. Graphy is one of the few tools in the space for visualizing data that ‘just works’.

  • Joe Tyndall

    Head of Finance at Seedcamp

    Few things get me as excited as beautiful charts do. Graphy has transformed the way we work with data for both internal and external content.

    Effortless dashboards all in one place, and the AI features mean we can now produce them rapidly, and keep them updated live.

  • Neil Gandhi

    Founder of Send.co

    Graphy creates all my external facing charts.

    AI does all the heavy work, and it’s drop dead gorgeous

  • Michael Cockburn

    Founder of Desana

    It was a complete game changer when Graphy started to allow me to prompt it for insights, fine tune them, and make beautiful visualizations out the other side.

    Feels like the future of storytelling in business.

  • Jakob Knutzen

    CEO & Co-Founder at Butter

    Graphy allows me to make beautiful, super customized charts. This makes my communications of numbers to both investors and team much clearer.

    Plus it's just fun to use 😊

  • Guillermo Rauch

    CEO at Vercel

    Stunning product.

  • David Jarvis

    Founder/CEO at Griffin

    I’ve been waiting for something like Graphy for nearly twenty years.

    Beautiful, insightful, and dead easy to use. I’m obsessed.

  • Jon Noronha

    Co-Founder and CPO at Gamma

    Graphy is the best library for user-friendly editable graphs.

    Visual polish, opinionated in the right ways, clean and simple display of information, nice interactivity Just the right amount of information to feel rigorous without being overwhelming for the person reading the graph.

From the team behind Graphy.app, loved by more than 500,000 data storytellers.

  • Cindy Ibanez

    Global Head of Marketing at Wynwood House

    My team were in love! They were like, oh my God, what is this, this is the future!

  • Joe Edwards

    Senior Growth Marketing Manager at Venafi

    Most other data tools are passive and leave it up to the stakeholders to interpret the numbers

    Graphy helps you create stunning charts from disparate sources with the context and commentary your stakeholders need.

  • Stan Massueras

    General Manager at Lattice

    Great ideas are only impactful when communicated clearly.

    Graphy enabled us to transform data into compelling stories, and those stories into meaningful action.

  • Ryan Hoover

    Founder of Product Hunt

    I’d rather eat cardboard than create another pivot table. Thanks, Graphy (I don’t like cardboard)

  • Nick Lafferty

    Founder at Early Exit Club

    Graphy is the first tool I use when I'm looking to quickly create stunning visuals for my newsletter, social feeds, and my consulting business. I'm not stuck using Google Sheet's terrible default graphs anymore!

  • Liam Shalon

    Director of Research and Development at Level Ventures

    Most of the BI/internal tools we have for generating reports suck so bad that it’s embarrassing. Graphy is one of the few tools in the space for visualizing data that ‘just works’.

  • Joe Tyndall

    Head of Finance at Seedcamp

    Few things get me as excited as beautiful charts do. Graphy has transformed the way we work with data for both internal and external content.

    Effortless dashboards all in one place, and the AI features mean we can now produce them rapidly, and keep them updated live.

  • Neil Gandhi

    Founder of Send.co

    Graphy creates all my external facing charts.

    AI does all the heavy work, and it’s drop dead gorgeous

  • Michael Cockburn

    Founder of Desana

    It was a complete game changer when Graphy started to allow me to prompt it for insights, fine tune them, and make beautiful visualizations out the other side.

    Feels like the future of storytelling in business.

  • Jakob Knutzen

    CEO & Co-Founder at Butter

    Graphy allows me to make beautiful, super customized charts. This makes my communications of numbers to both investors and team much clearer.

    Plus it's just fun to use 😊

  • Guillermo Rauch

    CEO at Vercel

    Stunning product.

  • David Jarvis

    Founder/CEO at Griffin

    I’ve been waiting for something like Graphy for nearly twenty years.

    Beautiful, insightful, and dead easy to use. I’m obsessed.

  • Jon Noronha

    Co-Founder and CPO at Gamma

    Graphy is the best library for user-friendly editable graphs.

    Visual polish, opinionated in the right ways, clean and simple display of information, nice interactivity Just the right amount of information to feel rigorous without being overwhelming for the person reading the graph.

get started

get started

Install and test it on your own machine.

Install the SDK and follow the docs to render your first chart. Get in touch when you're ready to use Graphy in production.

Install the SDK and follow the docs to render your first chart. Get in touch when you're ready to use Graphy in production.

01 install

Add Graphy to your app

npm install @graphysdk/react

02 render

Render your first chart

<GraphProvider input={spec} data={data}>
  <GraphRenderer />
</GraphProvider>

03 go live

Use Graphy in production.

Tell us what you are building. We will help with the right licence, integration path and support.

2026 Graphy Technologies Ltd. All rights reserved.

2026 Graphy Technologies Ltd. All rights reserved.

2026 Graphy Technologies Ltd. All rights reserved.

2026 Graphy Technologies Ltd. All rights reserved.