
Stop building charts.
Hire our agents.
Agents
AI that doesn't make up your numbers.
Graph Creation Agents
They take:
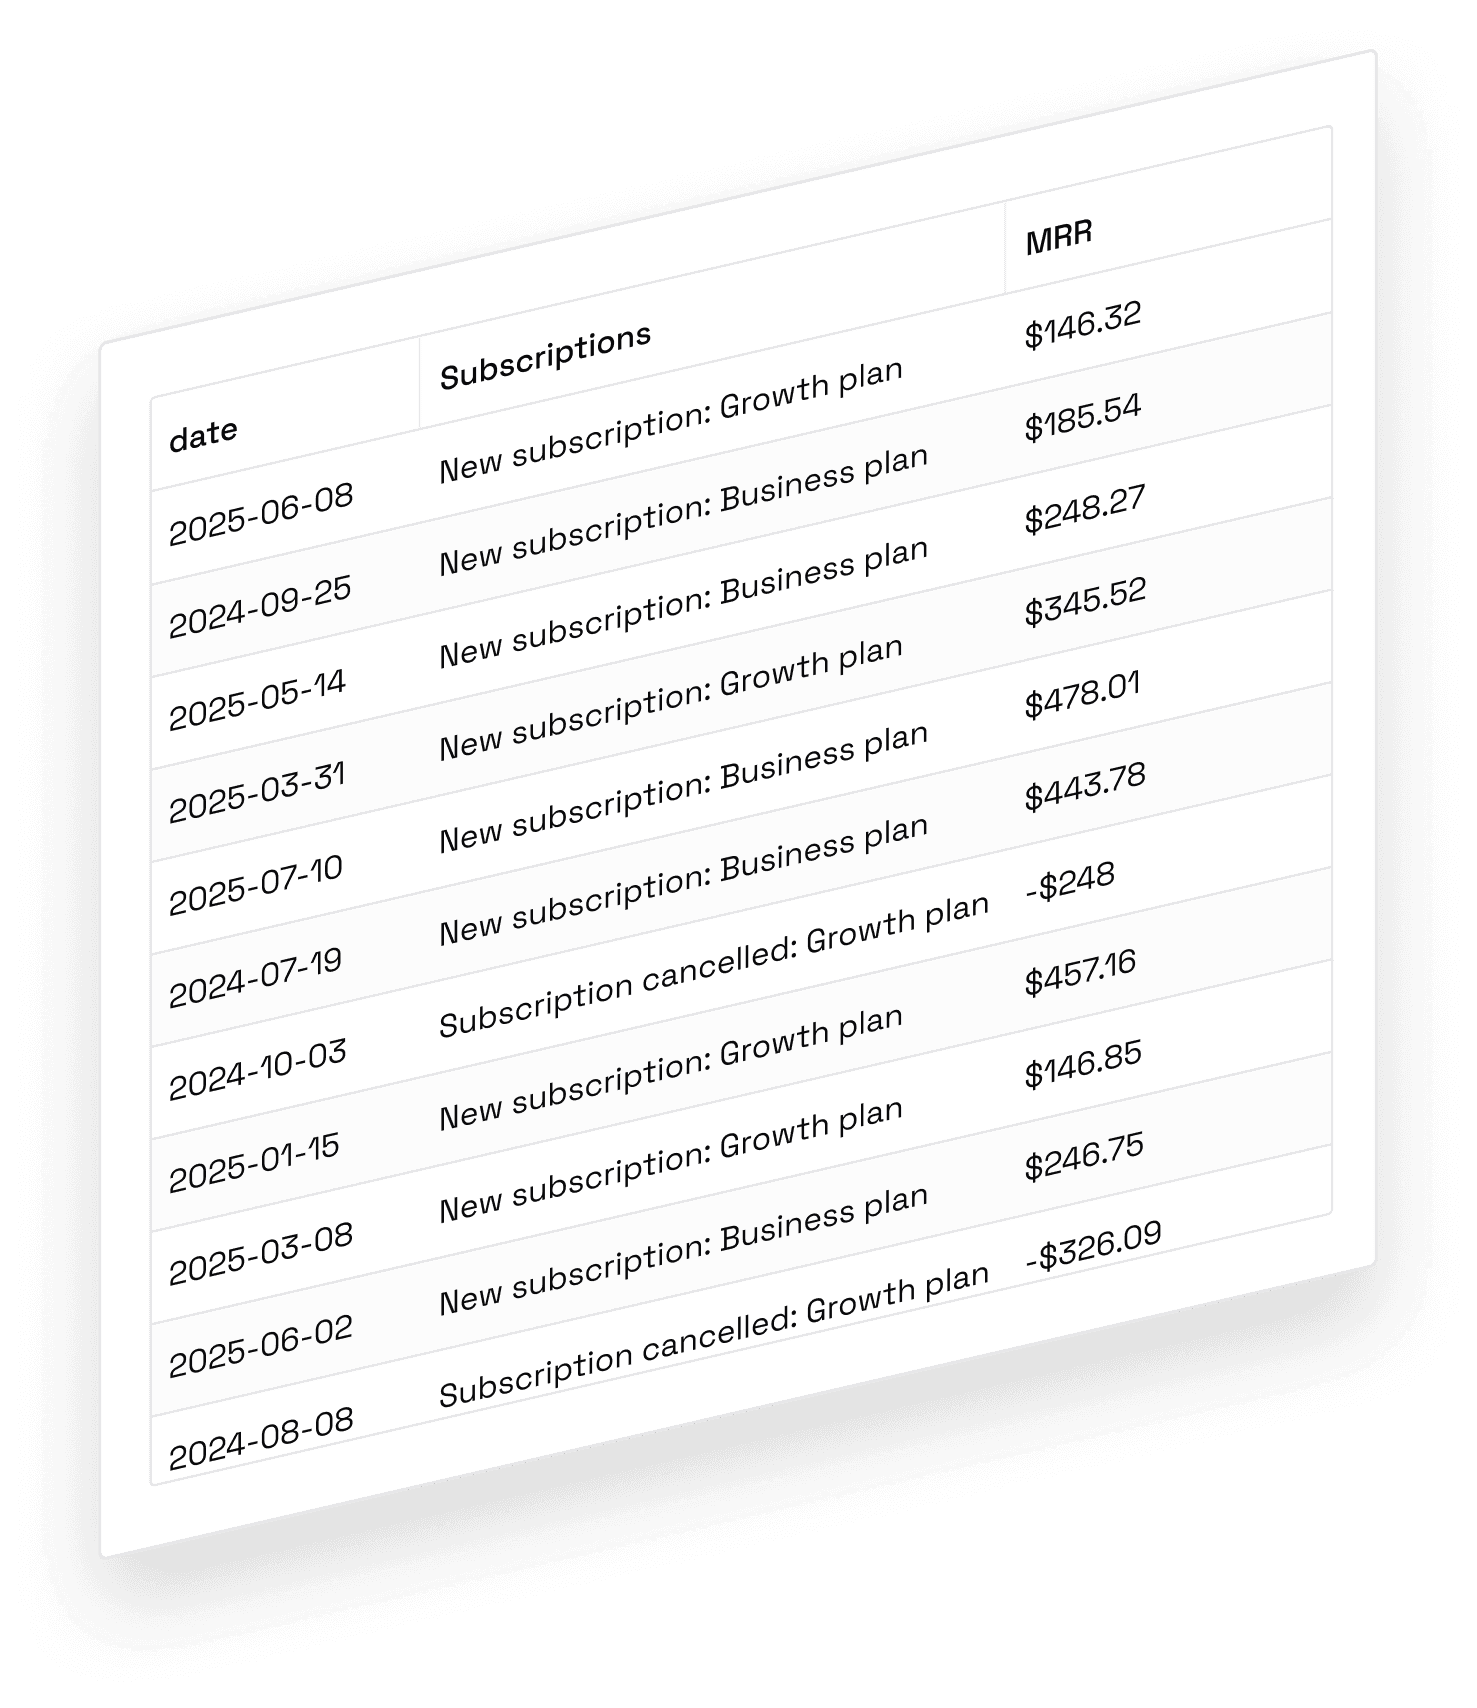
messy or raw data
and/or a natural language instruction
And return:
clean, structured data
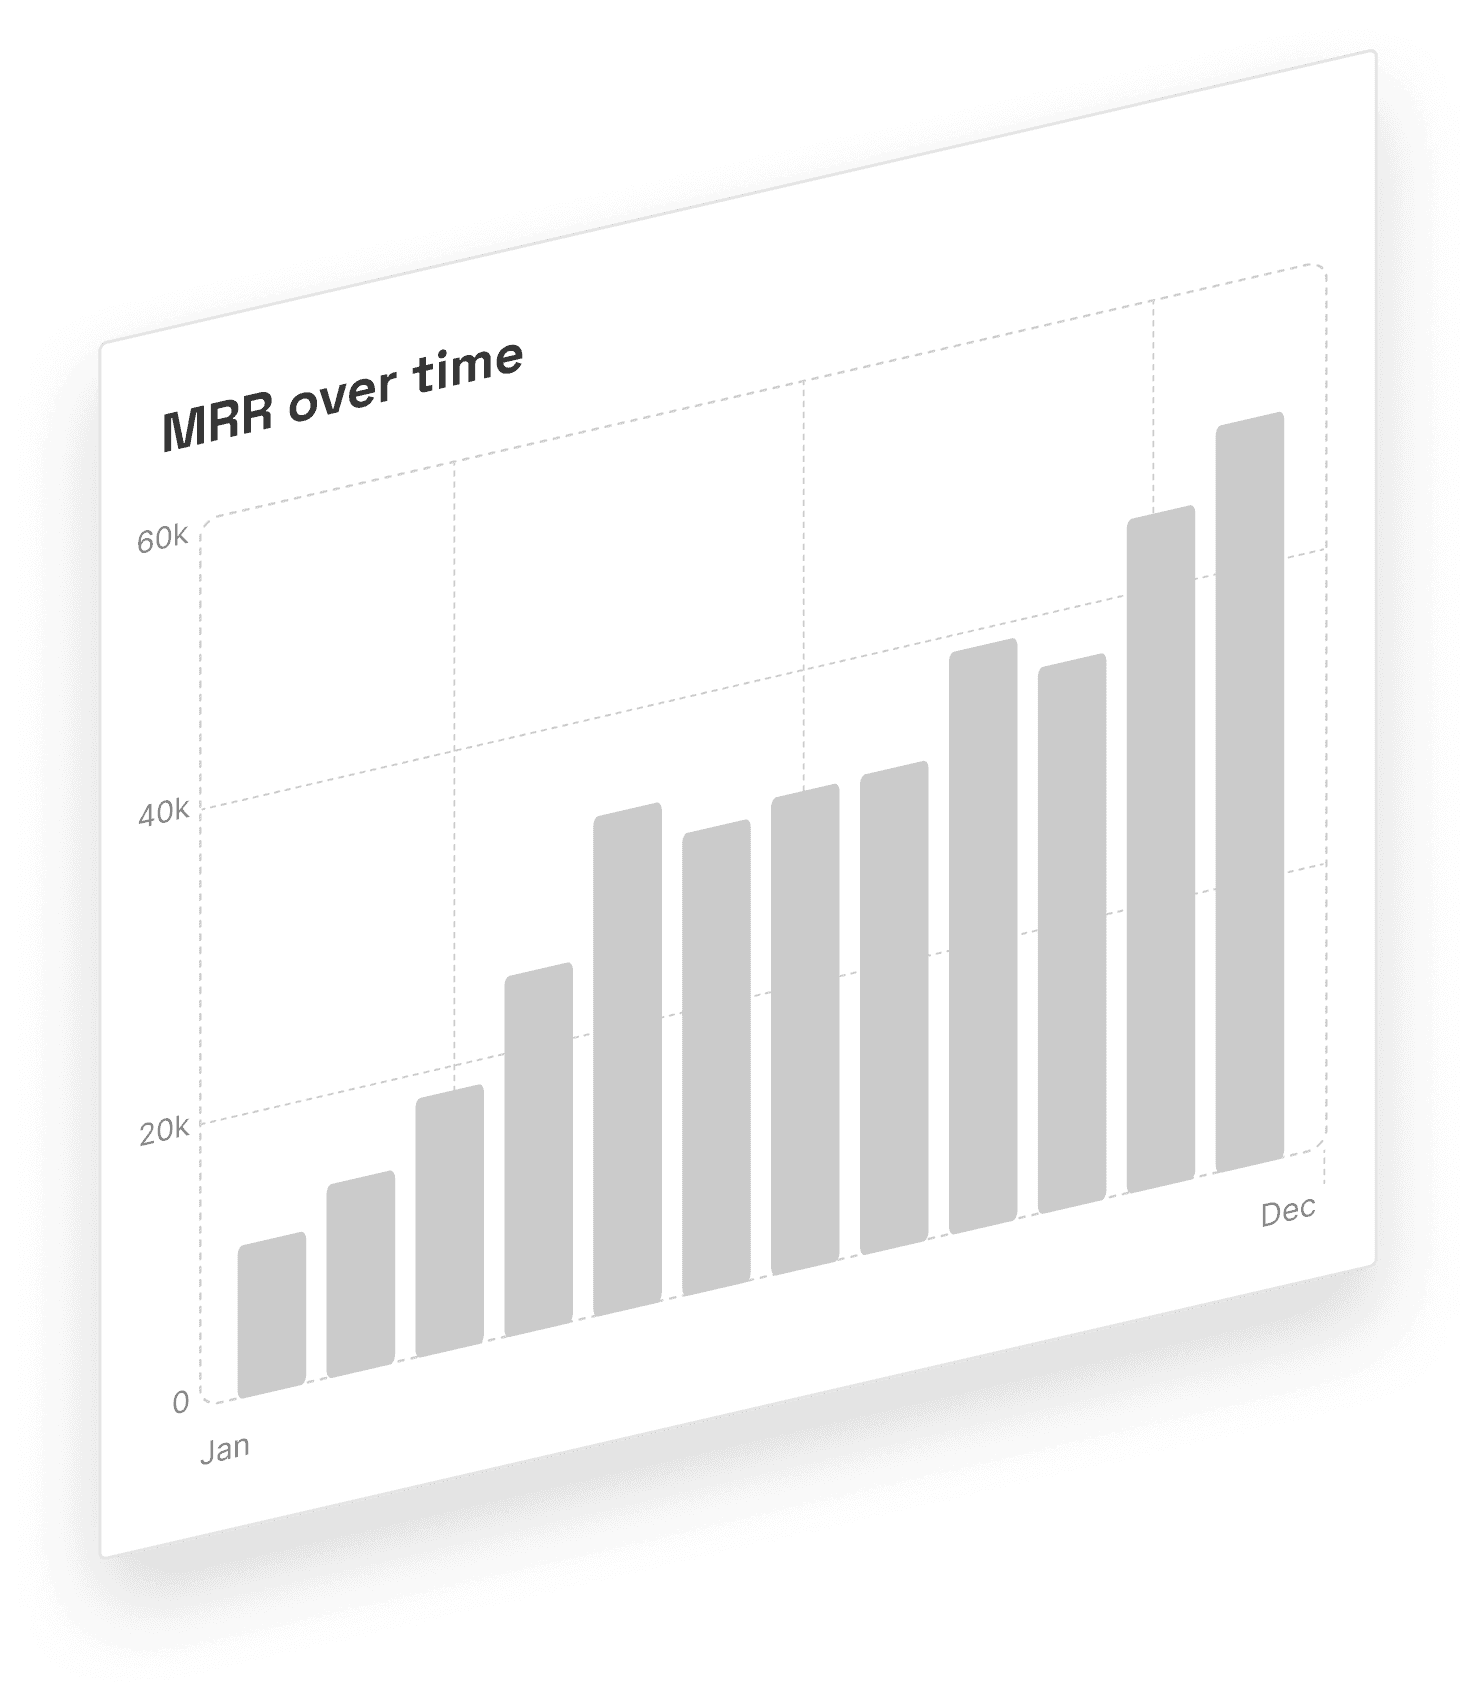
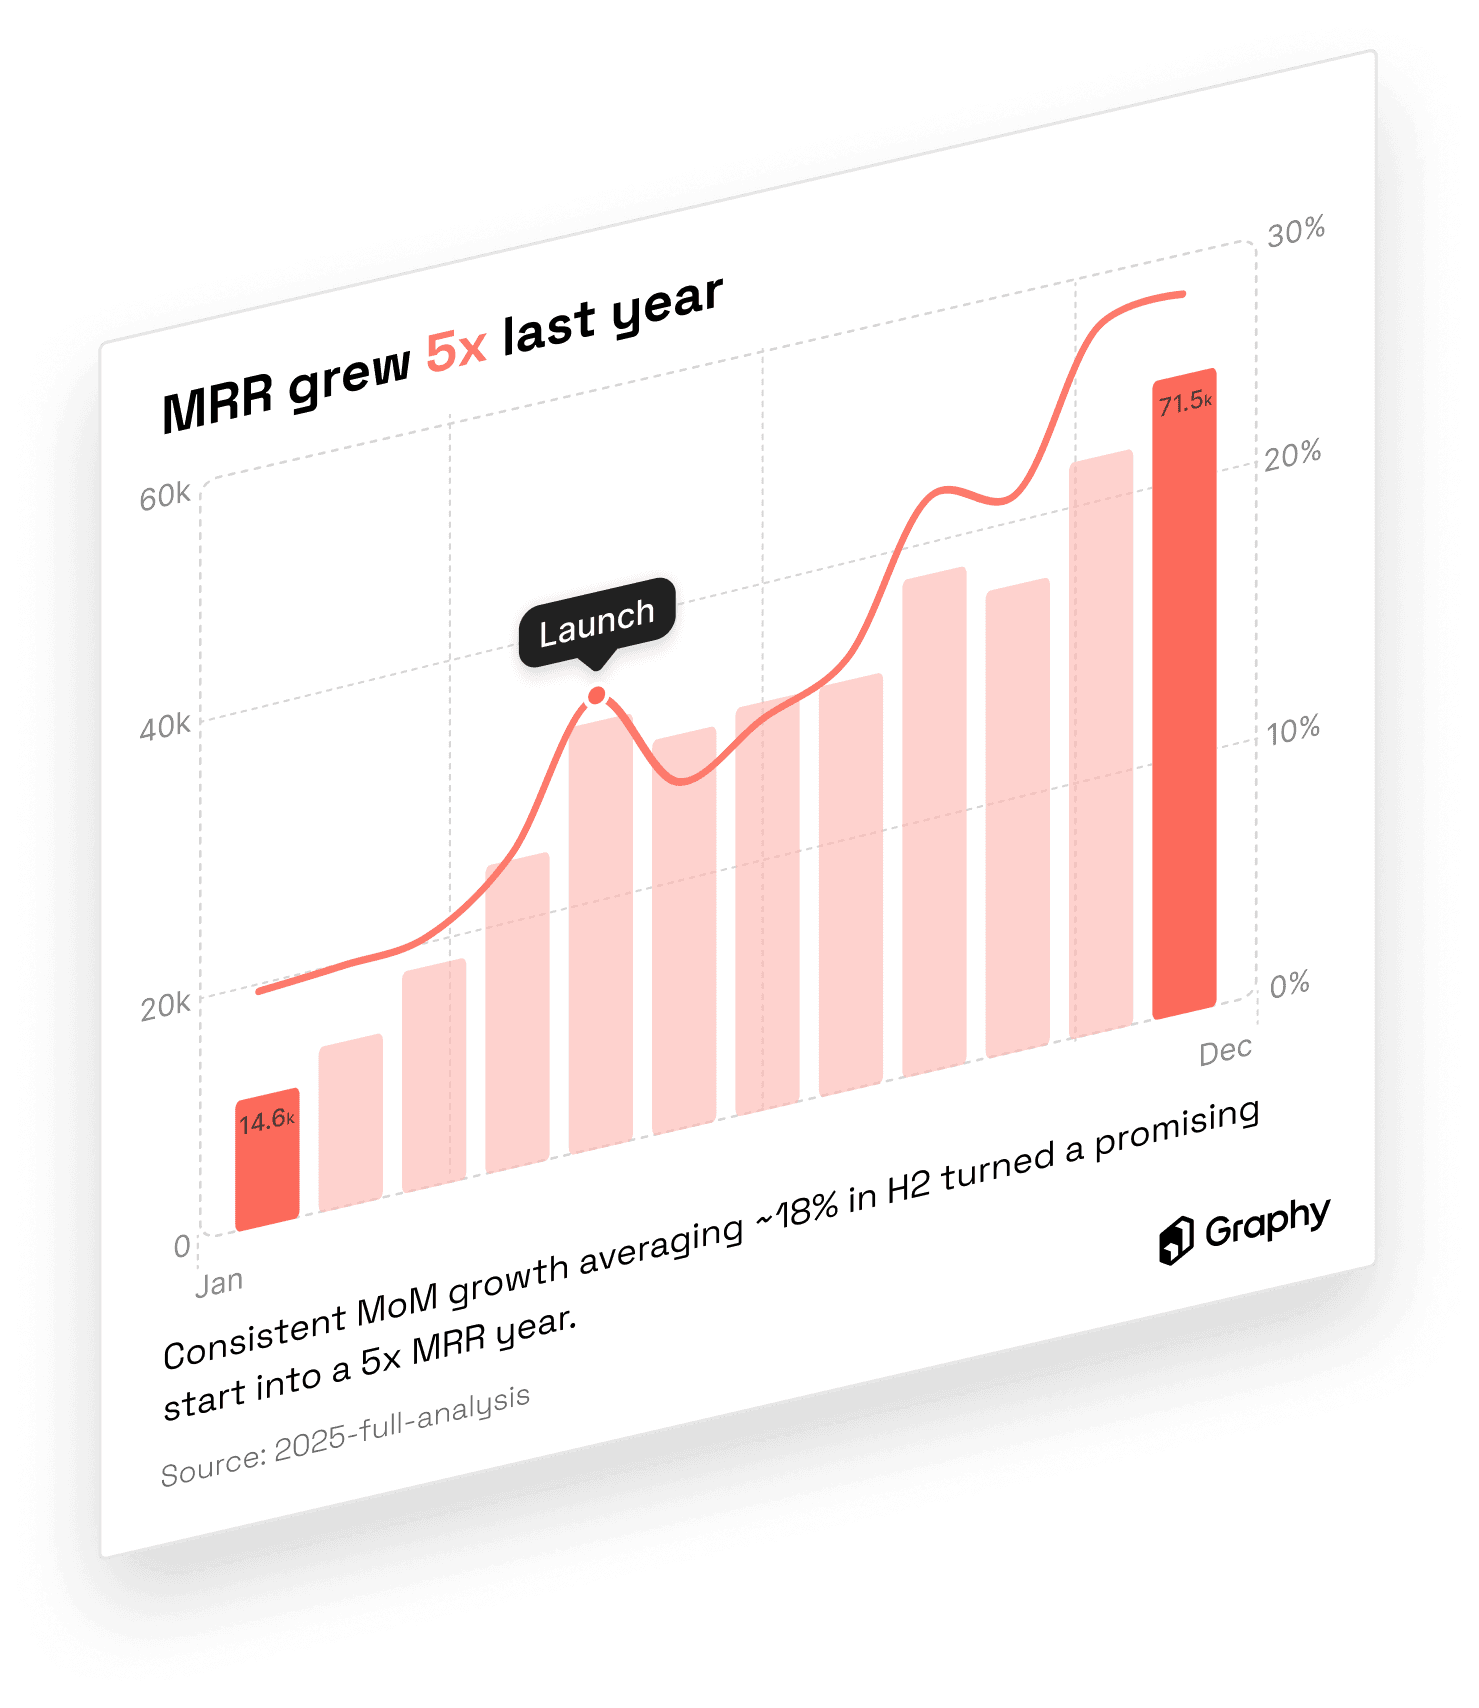
a chart configuration that the SDK can render
narrative, story, annotations, text insights or highlights
INPUT
QuarterlyReport.csv
Date
2009-01
2009-02
2009-03
2009-04
2009-05
Chrome
1.39
1.5
1.71
2.05
2.4
IE
1.39
1.5
1.71
2.05
2.4
Firefox
26.85
27.66
29.17
29.41
28.5
Financials-Q1
select columns
for x / y
GROUP AND SUMMARISE DATA
FILTER OUTLIERS AND ANOMALIES
FILL MISSING DATA POINTS
GROUP BY
FISCAL YEAR
REMOVE DUPLICATES
HIGHLIGHT TOP PERFORMERS
IDENTIFY TRENDS AND PATTERNS
sort for
visual clarity
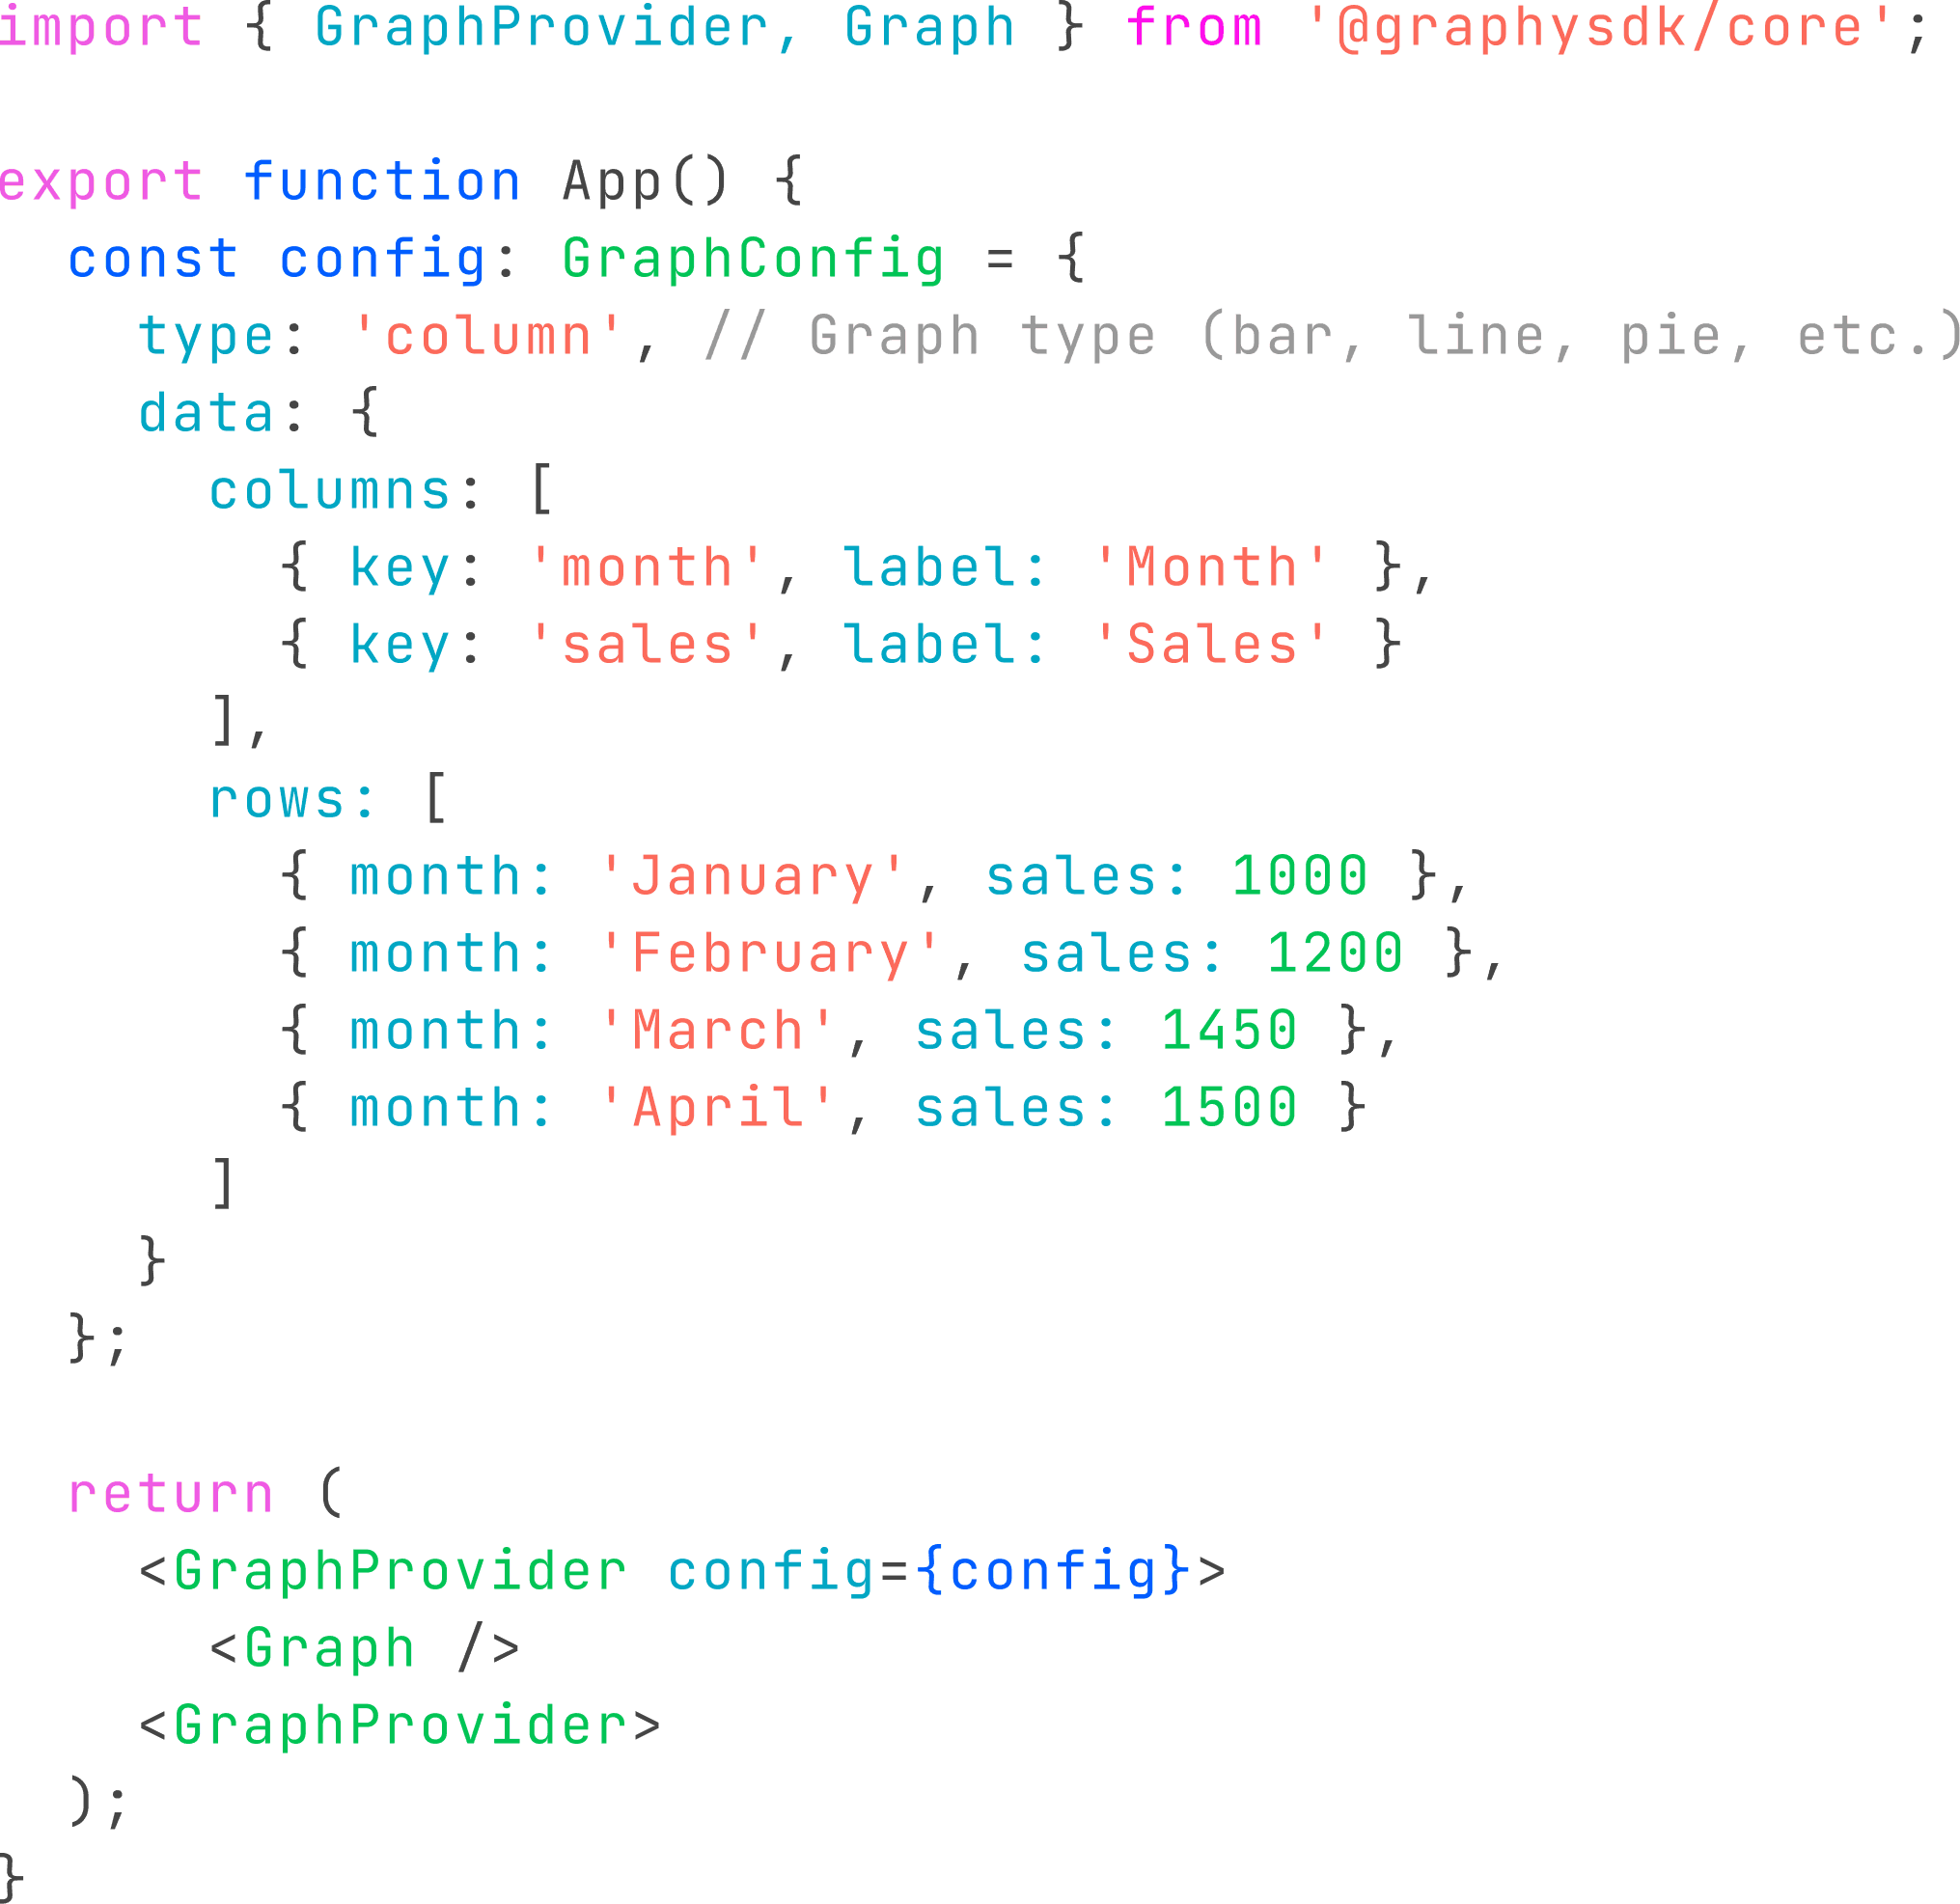
sdk
Rendered graphs
Area graph
Waterfall graph
Combo graph
Bubble graph
Column graph
Pie graph
Line graph
benefits


SDK
Charts that look like you built them.
CHART RENDERER
Polished, modern visualizations
Performant with large datasets
Interactive charts for exploration
20+ chart types and growing
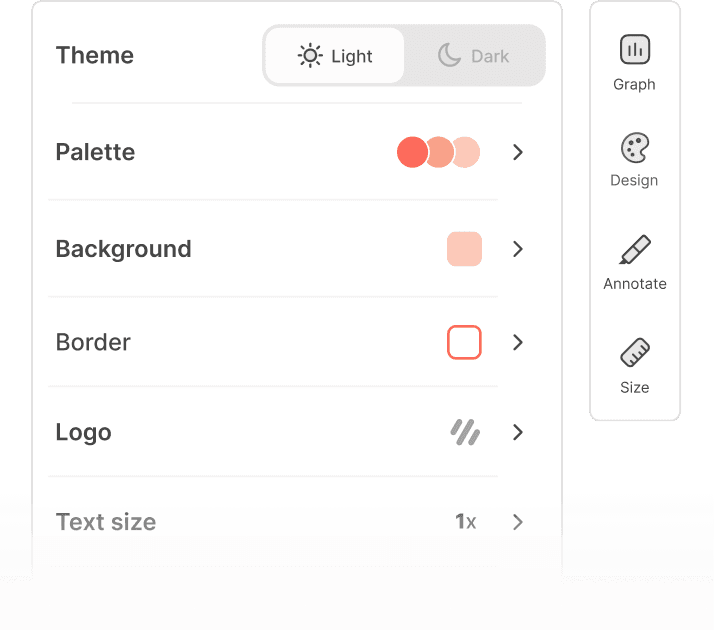
EDITOR
Plug-and-play editor controls
All the logic handled, consumer-grade UX
Tweak without breaking the chart
White-label styling
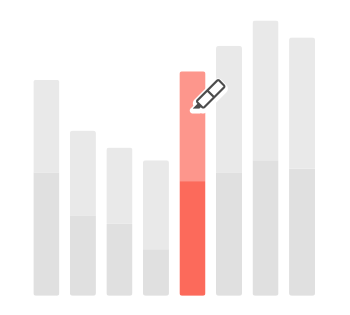
ANNOTATIONS
Highlights, callouts, arrows, captions
Shaded areas, difference indicators
Turns a chart into the answer
Built natively, easy to extend and style
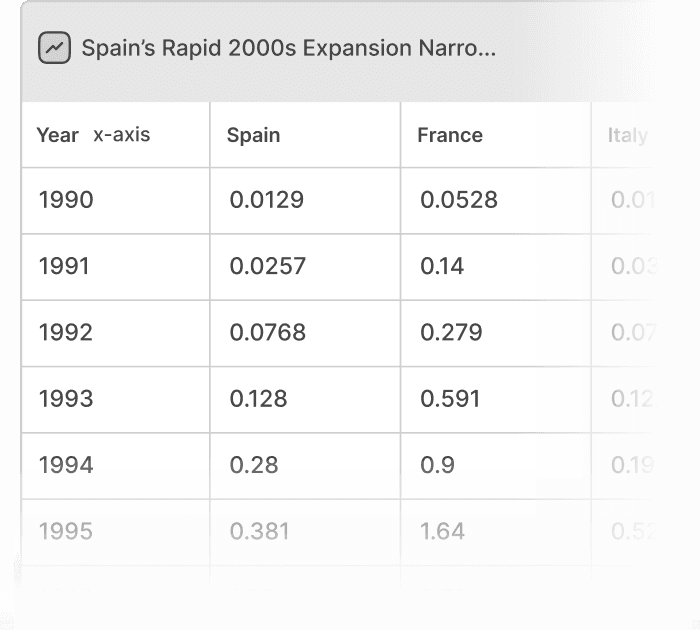
data table
Paste and edit data directly
Work with the data, not just view it
Copy/paste from spreadsheets