Can Graphy run DOOM?
36,000 rows and a custom SVG renderer: how we turned DOOM into a playable Graphy heatmap.
6 min read
Featured image
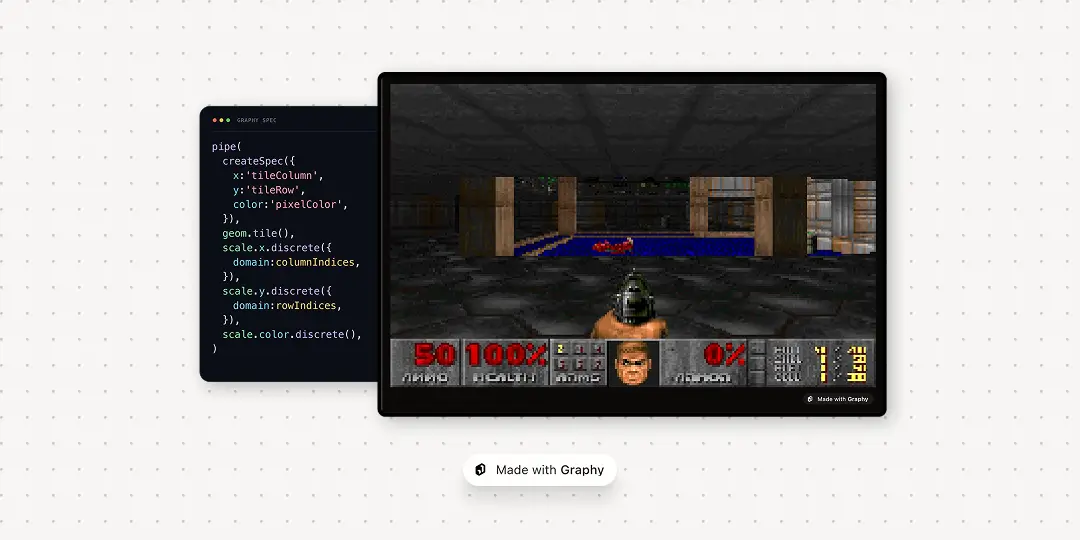
DOOM has spent decades turning up in places it was never designed to run. Behind the joke though there are real engineering challenges in taking a system, pushing it far beyond its usual job, and seeing what breaks first.
At Graphy, we’ve built a charting SDK which is designed for building creative, expressive charts, so we decided to see how it would handle this test.
The idea of building a game on top of a chart renderer becomes more plausible when you look at a game frame as data; a grid of positions and colours. Give each cell a column, row and hex value, and DOOM starts to look suspiciously like a heatmap…
Every frame becomes a table of up to 36,000 rows, which Graphy turns into coloured tiles quickly enough for you to move and shoot. You can hover a tile to inspect its data, and even switch to polar coordinates and watch the same frame wrap into a circle for a weird ‘360 degree camera’ effect.
Whilst the end result feels like a bit of fun, there were some useful engineering problems to overcome. We had to compile a large, fast-changing dataset, work around the cost of painting tens of thousands of SVG elements, and keep the chart’s interactions alive while the data changed under them. The result pushed our renderer hard and exposed where the SDK’s extension points held up.
How it works
Every frame is a dataset. DOOM runs in the browser through WebAssembly, and for each frame, we sample colours from the game’s image and turn them into rows:
tileColumn | tileRow | pixelColor |
|---|---|---|
120 | 75 | #54af48 |
121 | 75 | #800101 |
122 | 75 | #740101 |
Each row says where a tile goes and what colour it should be. That is enough to describe a heatmap:
We hide the axes and legend, remove the gaps between tiles and feed the chart a new table as the game runs.
At 960×600 with four-pixel tiles, the table has 240 columns and 150 rows: 36,000 data points per frame.
The demo keeps the chart machinery visible. Hover a tile and the tooltip shows its column, row and colour. Below the game, a live table shows a sample of the current frame alongside the spec that renders it.
The same rows, wrapped into a circle
The Radial switch in the demo changes two lines of the spec:
The column becomes an angle and the row becomes a distance from the centre. The same frame data now forms a circular point chart, and the game keeps running.
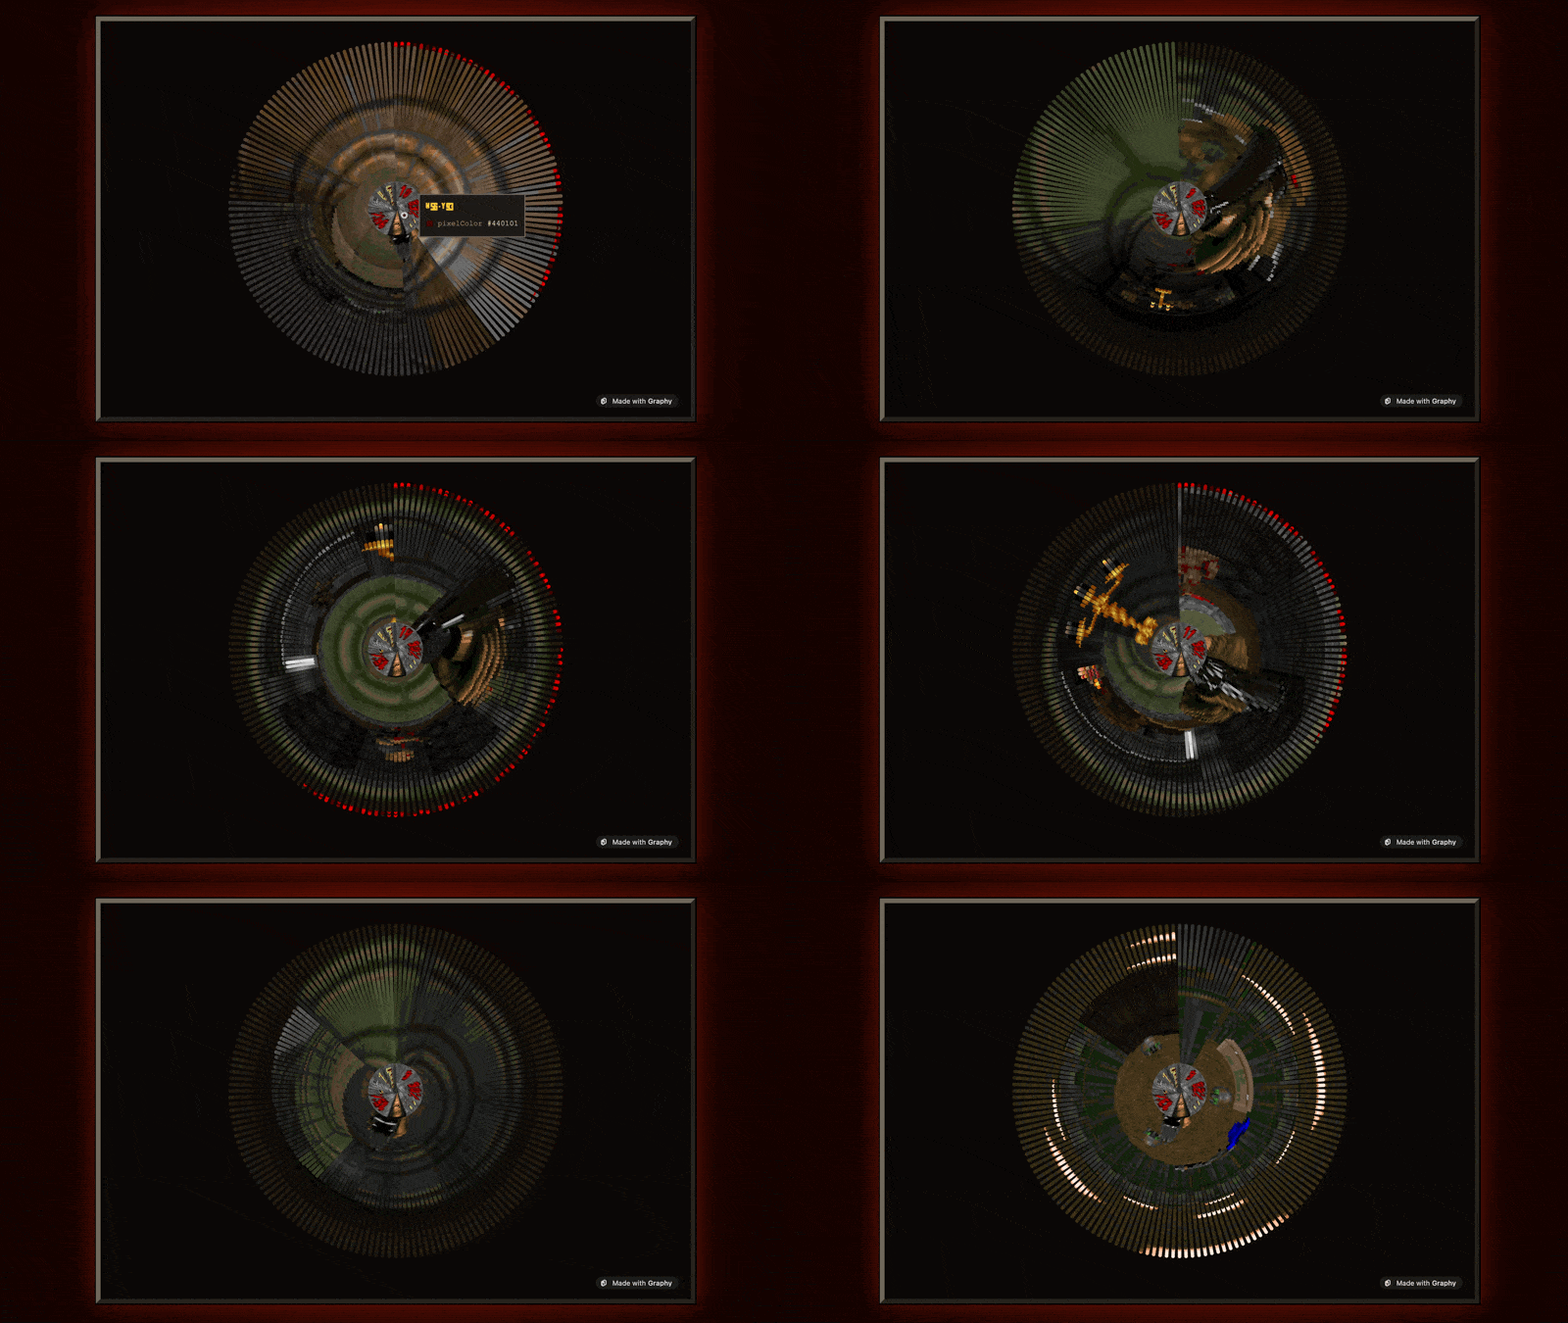
It is a terrible way to play DOOM, but it makes the mechanism obvious. The image is passing through a chart specification rather than sitting on top of one.
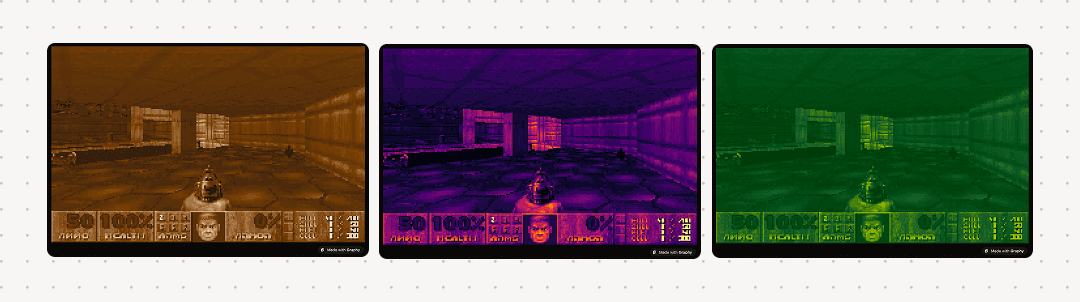
The controls also restyle the same rows six ways. Original keeps DOOM’s palette. Thermal, Game Boy, Sepia and Noir remap luminance through Graphy’s colour scales; CRT filters out alternate scanlines so the chart background shows through. There is no image filter sitting over the game: the look is produced purely by the chart spec.
The bottleneck was the browser’s SVG tree
Graphy separates chart computation from painting. The viz engine compiles the spec and data into positions, sizes, colours and layout. The React renderer paints that result as SVG.
Our first version used Graphy’s standard tile renderer, which creates one SVG rectangle for each tile. The engine could process the data, but asking the browser to update tens of thousands of SVG elements for every frame was expensive.
DOOM uses a palette of at most 256 colours. That gave us a way to reduce the browser’s work.
We wrote a render-only plugin with Graphy’s defineGeomRenderer. It takes the positions, sizes and colours the engine has already calculated, groups tiles by colour, and draws one SVG path for each colour. Neighbouring tiles of the same colour merge into strips inside those paths.
Thirty-six thousand rectangles become at most 256 paths.
The plugin changes the final paint step. Graphy still handles the spec, scales, layout, styling, hover indexing and tooltip machinery. We did not need to fork the engine.
On the test laptop, production builds of the 16,000-tile configurations reached roughly 35 frames per second. The sharper 36,000-tile configuration ran at around 20. These are observations from one machine, not a portable benchmark; the result varies by browser and device.
The game itself ticks at 35 Hz, so the chart cannot display more game frames than that. We also found that React’s development checks made the same page two to four times slower. If you try something similar, measure the production build.
Keep the game away from the chart thread
We used doom.wasm, built on doomgeneric, to run DOOM’s C code in the browser. The game runs in a Web Worker, leaving the main thread to compile and paint the chart and handle the page.
The pipeline looks like this:
Frames move between the worker and the page through transferable buffers. The worker fills a buffer and transfers ownership to the page. Once the page has read it, the buffer goes back for reuse. This avoids copying a frame buffer on every handoff.
Keyboard and gamepad input travel in the other direction as key presses.
DOOM needed its sound back
The doom.wasm version we started from was silent. We added a small C bridge that forwards sound and music requests to JavaScript, then rebuilt the WebAssembly module.
Sound effects become audio buffers played through the Web Audio API. For music, we convert DOOM’s MUS format to MIDI and run libADLMIDI in an AudioWorklet to recreate the FM-synth soundtrack. Browsers require an interaction before audio can start, so the first click enables it.
The patched game source is available from the repository’s tagged release.
The experiment found a real tooltip bug
When the data changed under a stationary pointer, Graphy’s default tooltip did not refresh. In this demo, it could keep showing a tile colour from an earlier frame.
The bug is on our backlog. For the demo, we used Graphy’s slots to replace the tooltip with a component that reads the hovered tile’s current colour on every frame.
That workaround kept the demo moving without a renderer fork or an SDK release. It also gave us a concrete live-data case to fix in the default tooltip.
Where the abstraction held
This experiment pushed our SDK far beyond ordinary charts and dashboards. Happily the table-to-chart compiler kept working throughout. We only hit the main limitation later, in the browser’s SVG DOM.
A renderer plugin swapped out the expensive paint strategy while preserving the scales, layout, styling and hover behaviour. coord.polar() turned the same rows into a different shape. Each of the six looks changes either the scales or the rows in the spec. A custom tooltip slot handles the live-data edge case while we fix the default tooltip behaviour.
All in all, it was a success.
And we also now have a heatmap you can shoot demons in.
Play DOOM in a chart · Explore Graphy · Read the SDK docs · View the source
Built with doom.wasm (GPL-2.0), doomgeneric, and libADLMIDI (LGPL). Our sound changes are available under GPL-2.0. The demo uses the DOOM shareware episode by id Software and Teko under the SIL Open Font License. DOOM is a registered trademark of ZeniMax Media. This project is not affiliated with or endorsed by id Software or ZeniMax. Partly inspired by @DiegoAndaiC who got The Odyssey running on a Base UI heatmap.
