Changelog
New features, improvements, and fixes to the Graphy SDK.
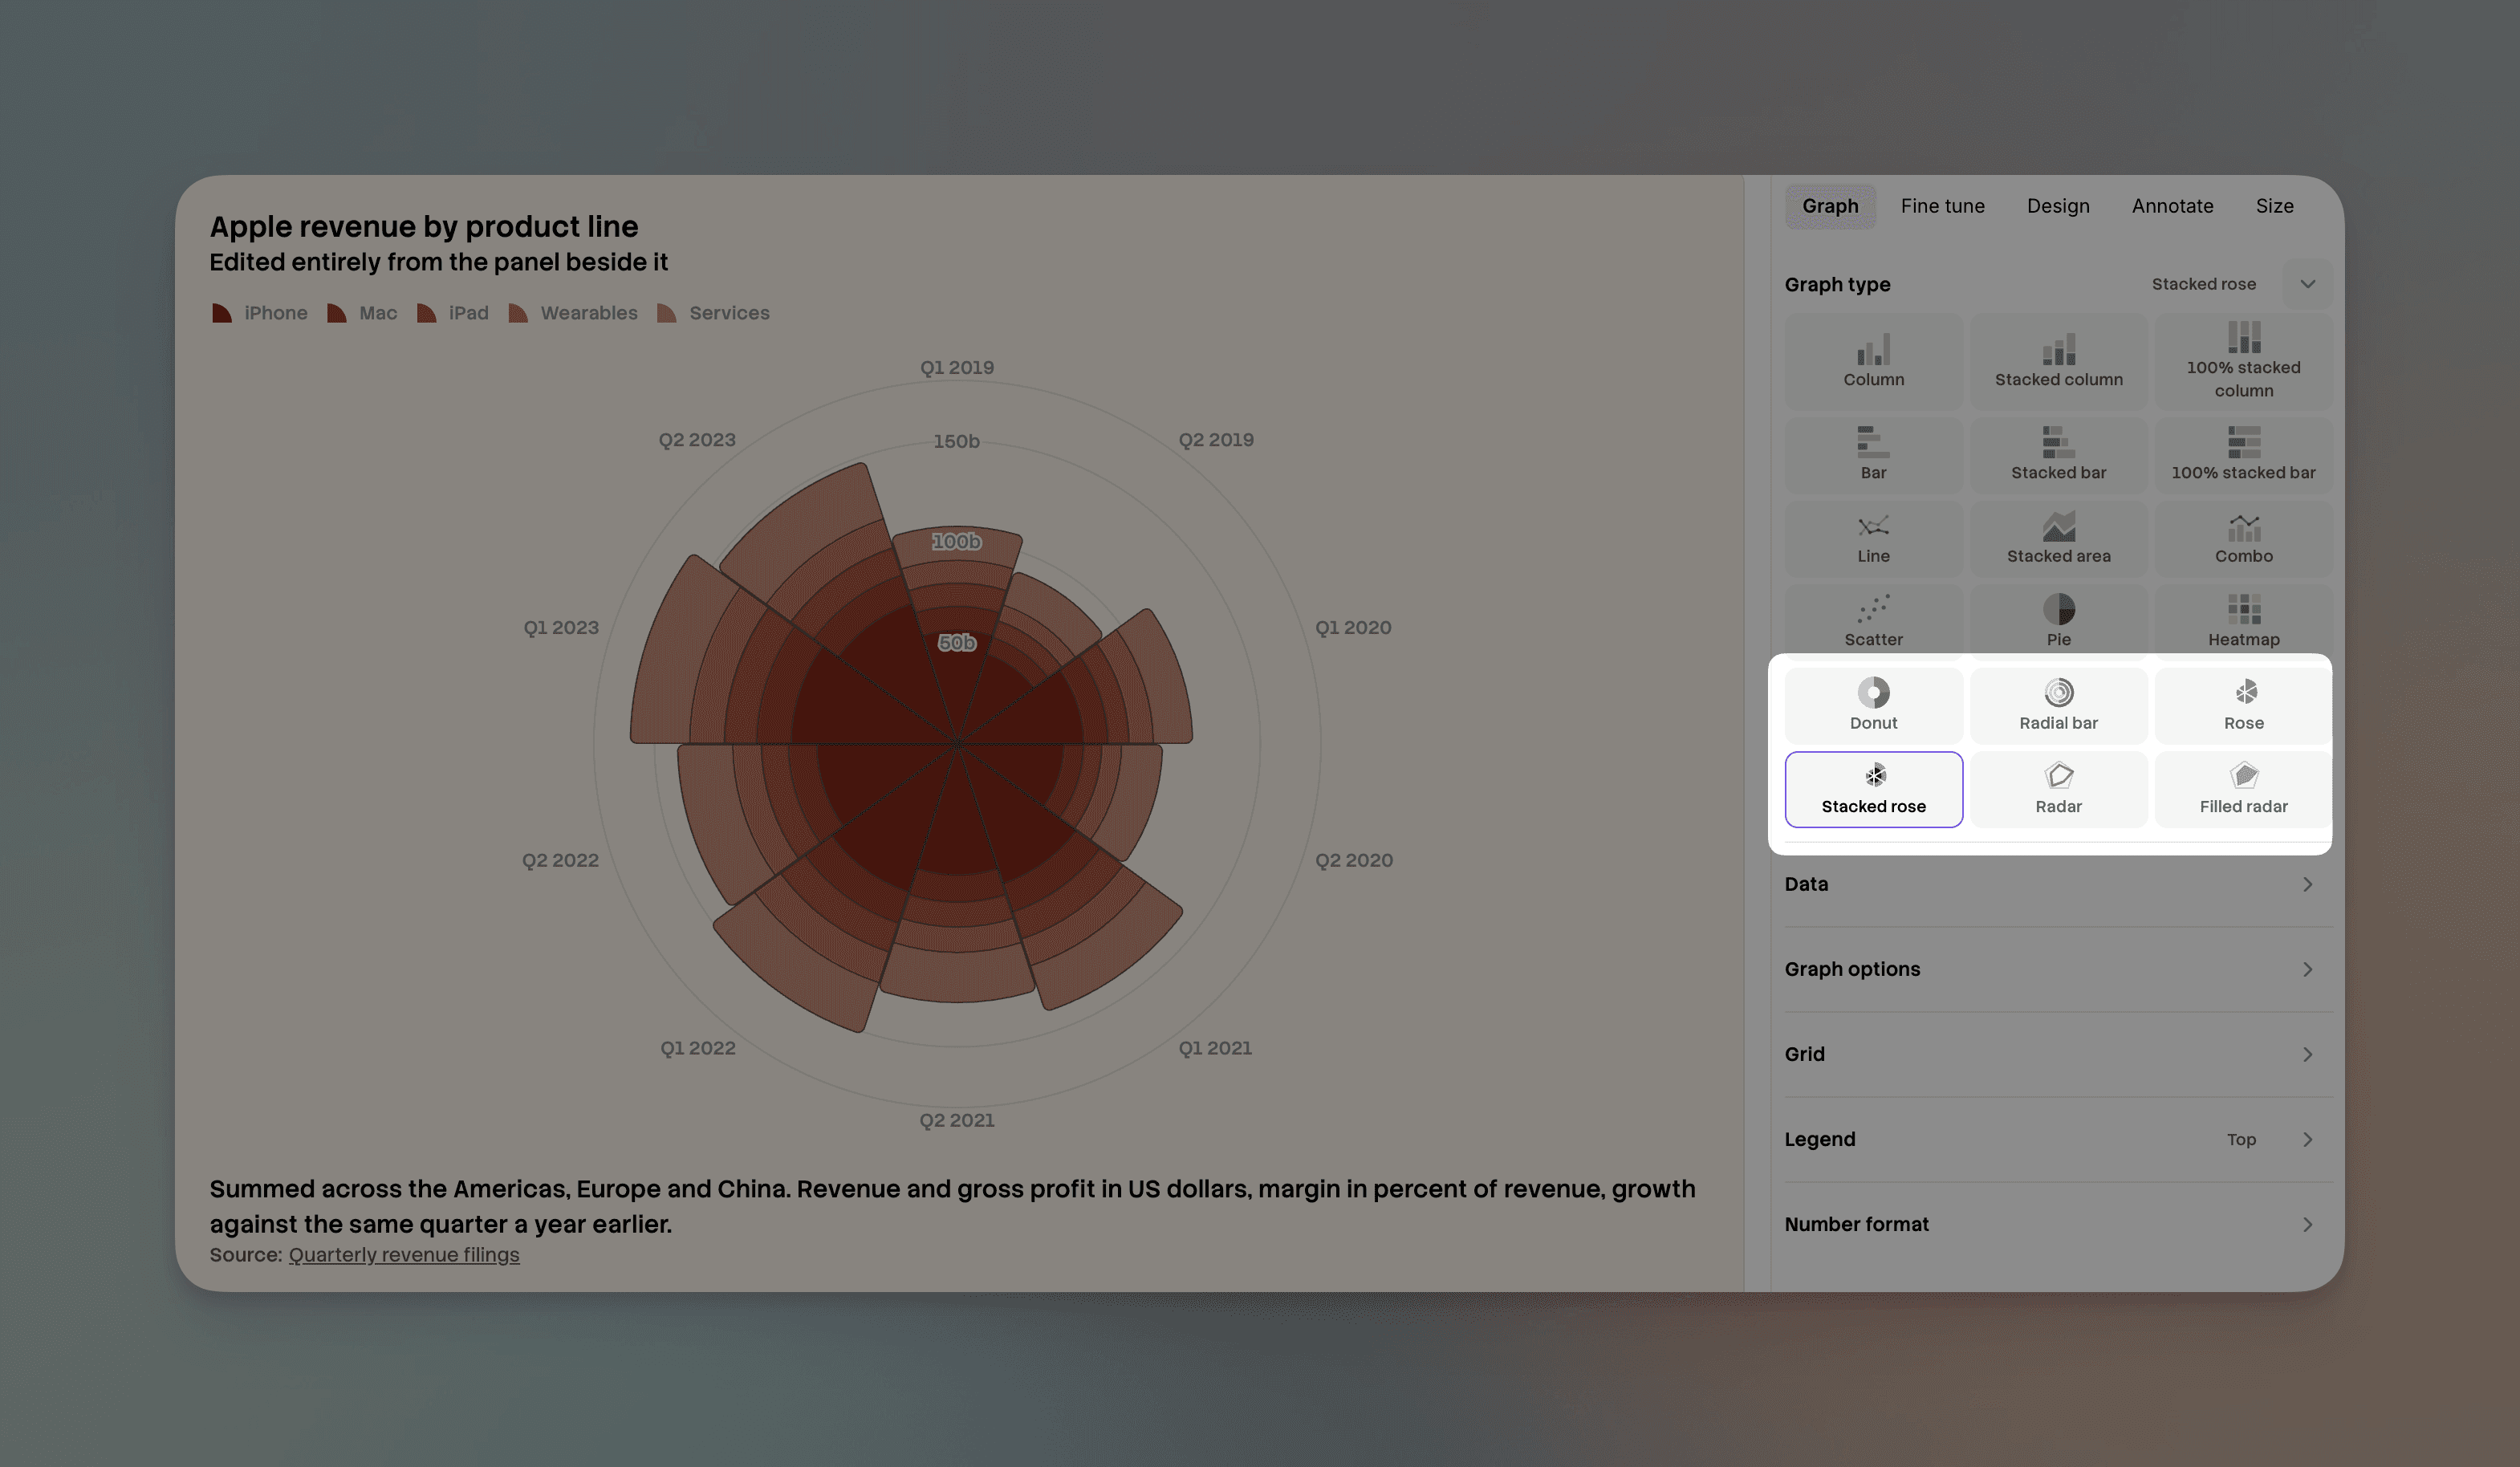
The graph type picker gains rose, stacked rose, radar, filled radar and radial bar. A radial bar draws one track per category, each curving round a central hole.
Turning a graph round now keeps its category axis unless the result is a pie or donut. Before, a polar graph with the value on the angle lost that axis, which collapsed a radial bar into a single stacked block of colour.
New default palettes
Graphs whose bars, lines or points stand apart from each other now start with an eight-colour multicolor palette. Where the pieces touch, as in stacked bars, stacked areas, pies and heatmaps, the new brick mono palette takes over instead. Both apply automatically. If you set your own colour scale, that still takes precedence.
Pin a number, leave a comment, drop a sticker, add a text box or draw a free arrow on a point of a pie, donut, rose or radar graph and it now lands on that point. Round graphs drawn with lines, areas or points used to drop anything anchored to a point without a word. Shapes, images and the other annotations that attach to a selection find their selection on round graphs too, and a sticker placed on the canvas stays where you put it.
Selections reach further on every graph as well. Area, point and heatmap layers now respond to them where they were previously skipped.
Data labels that stay legible
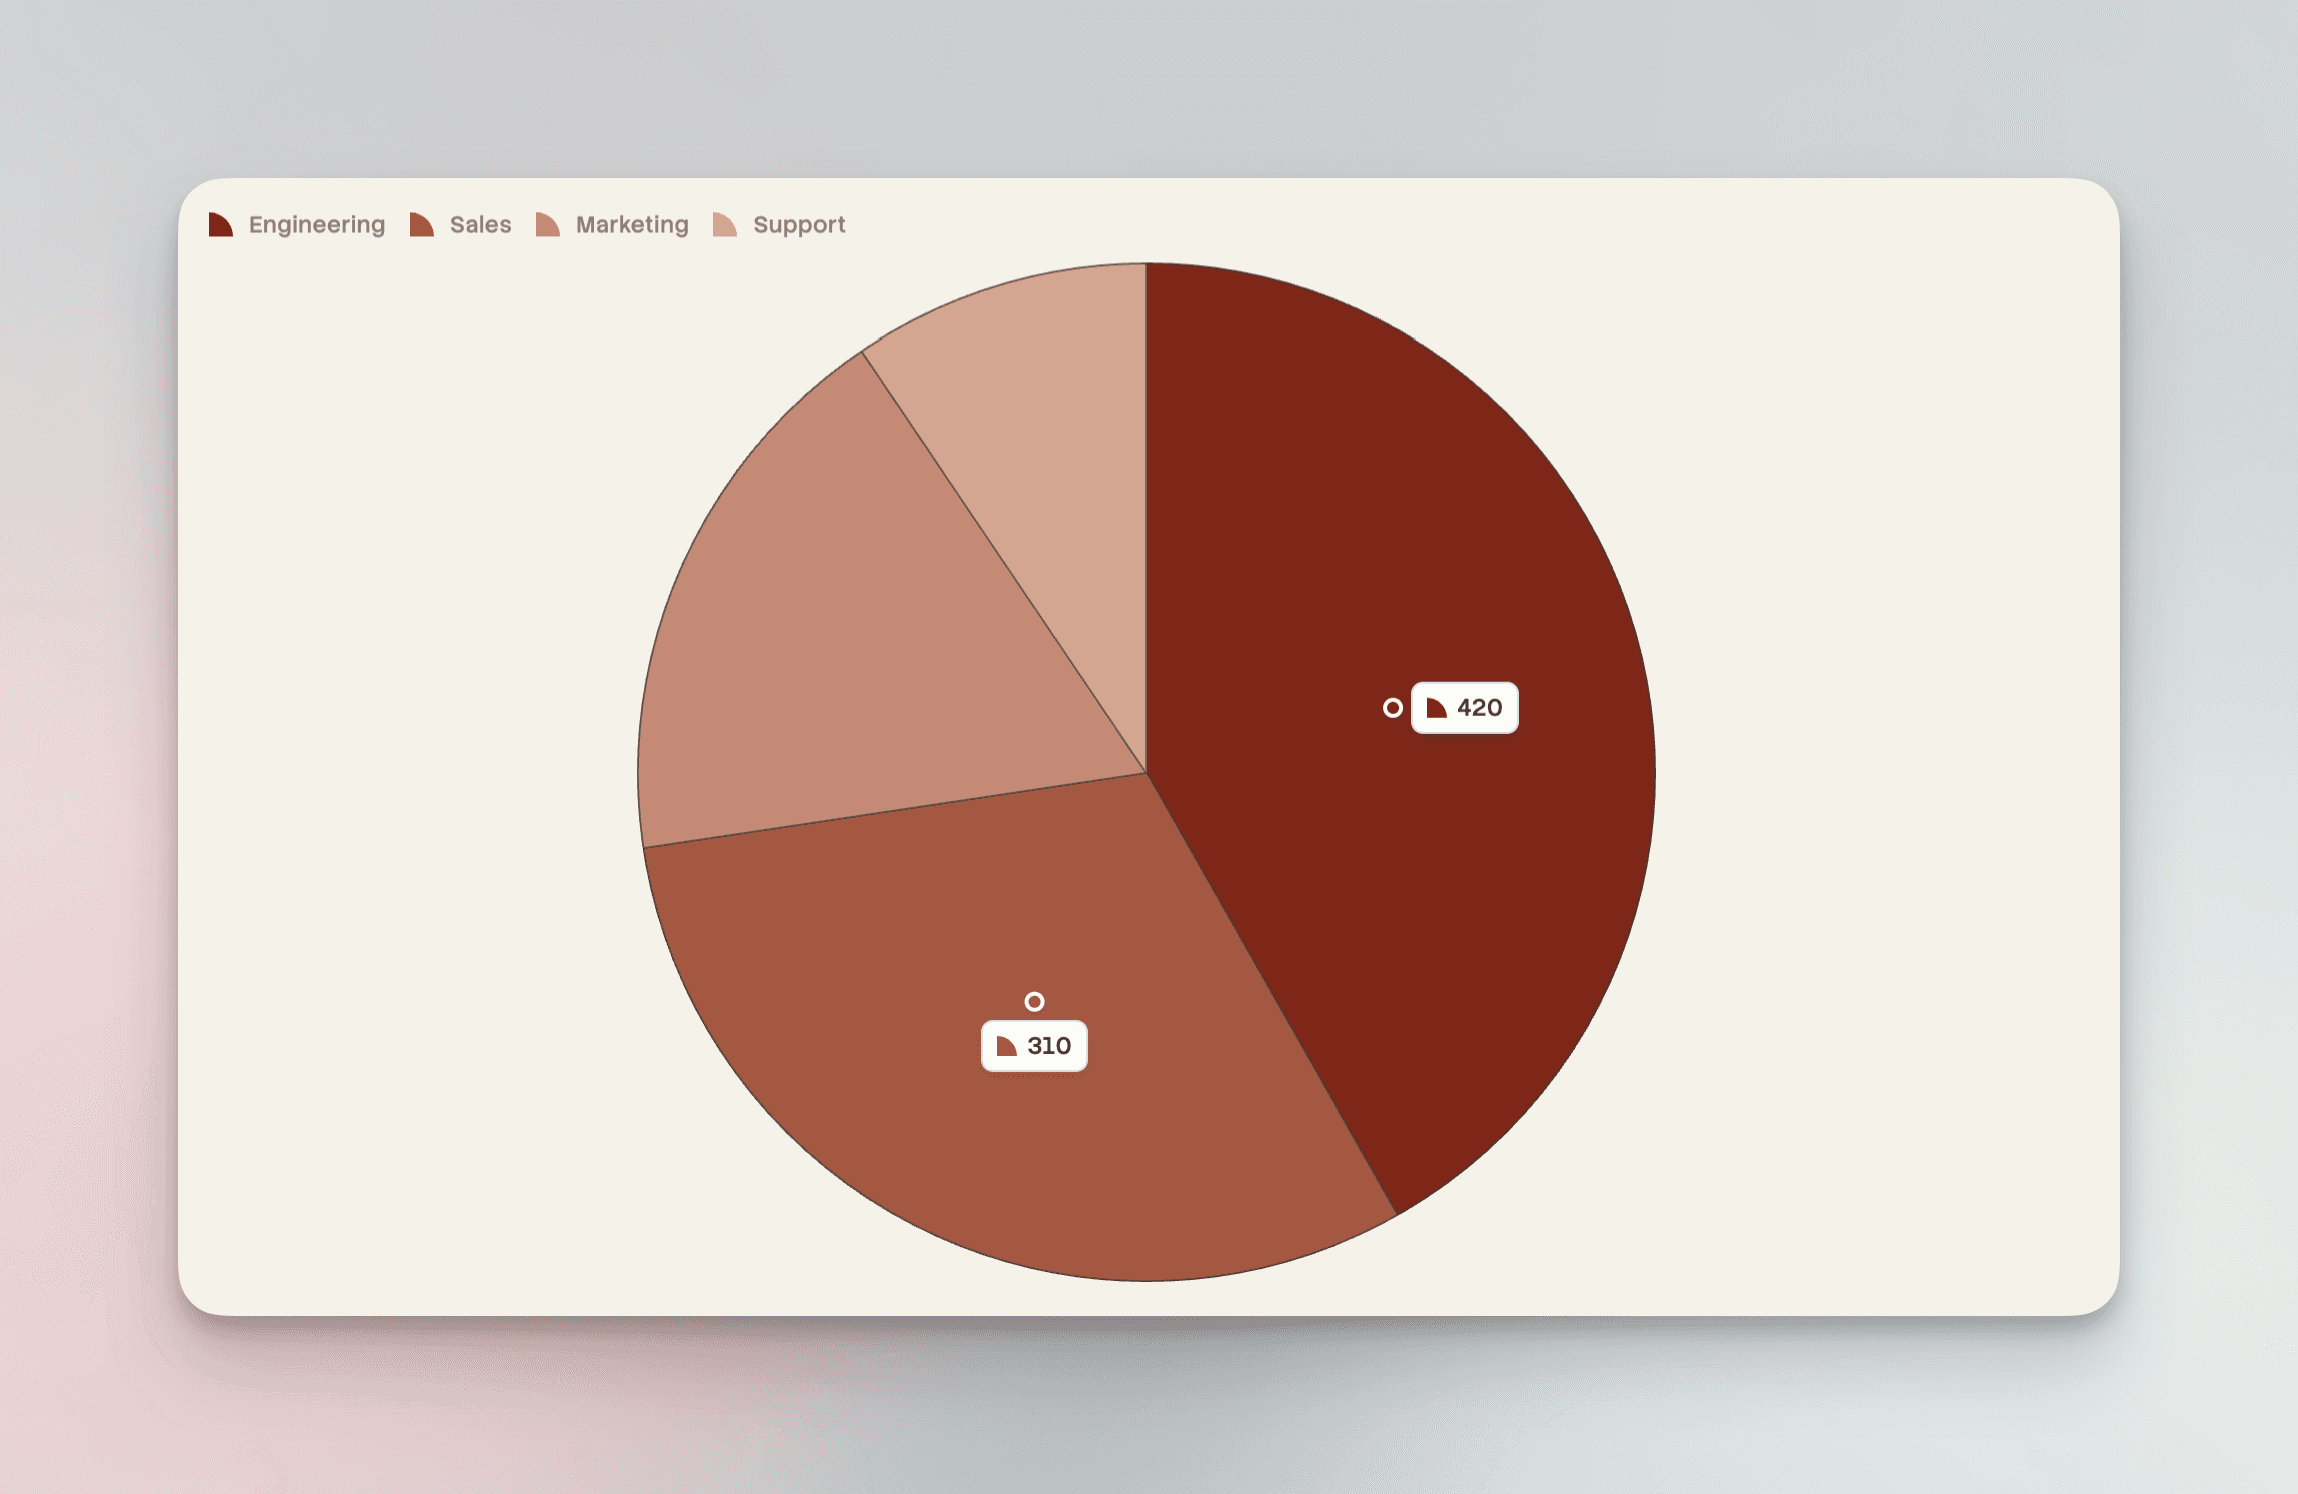
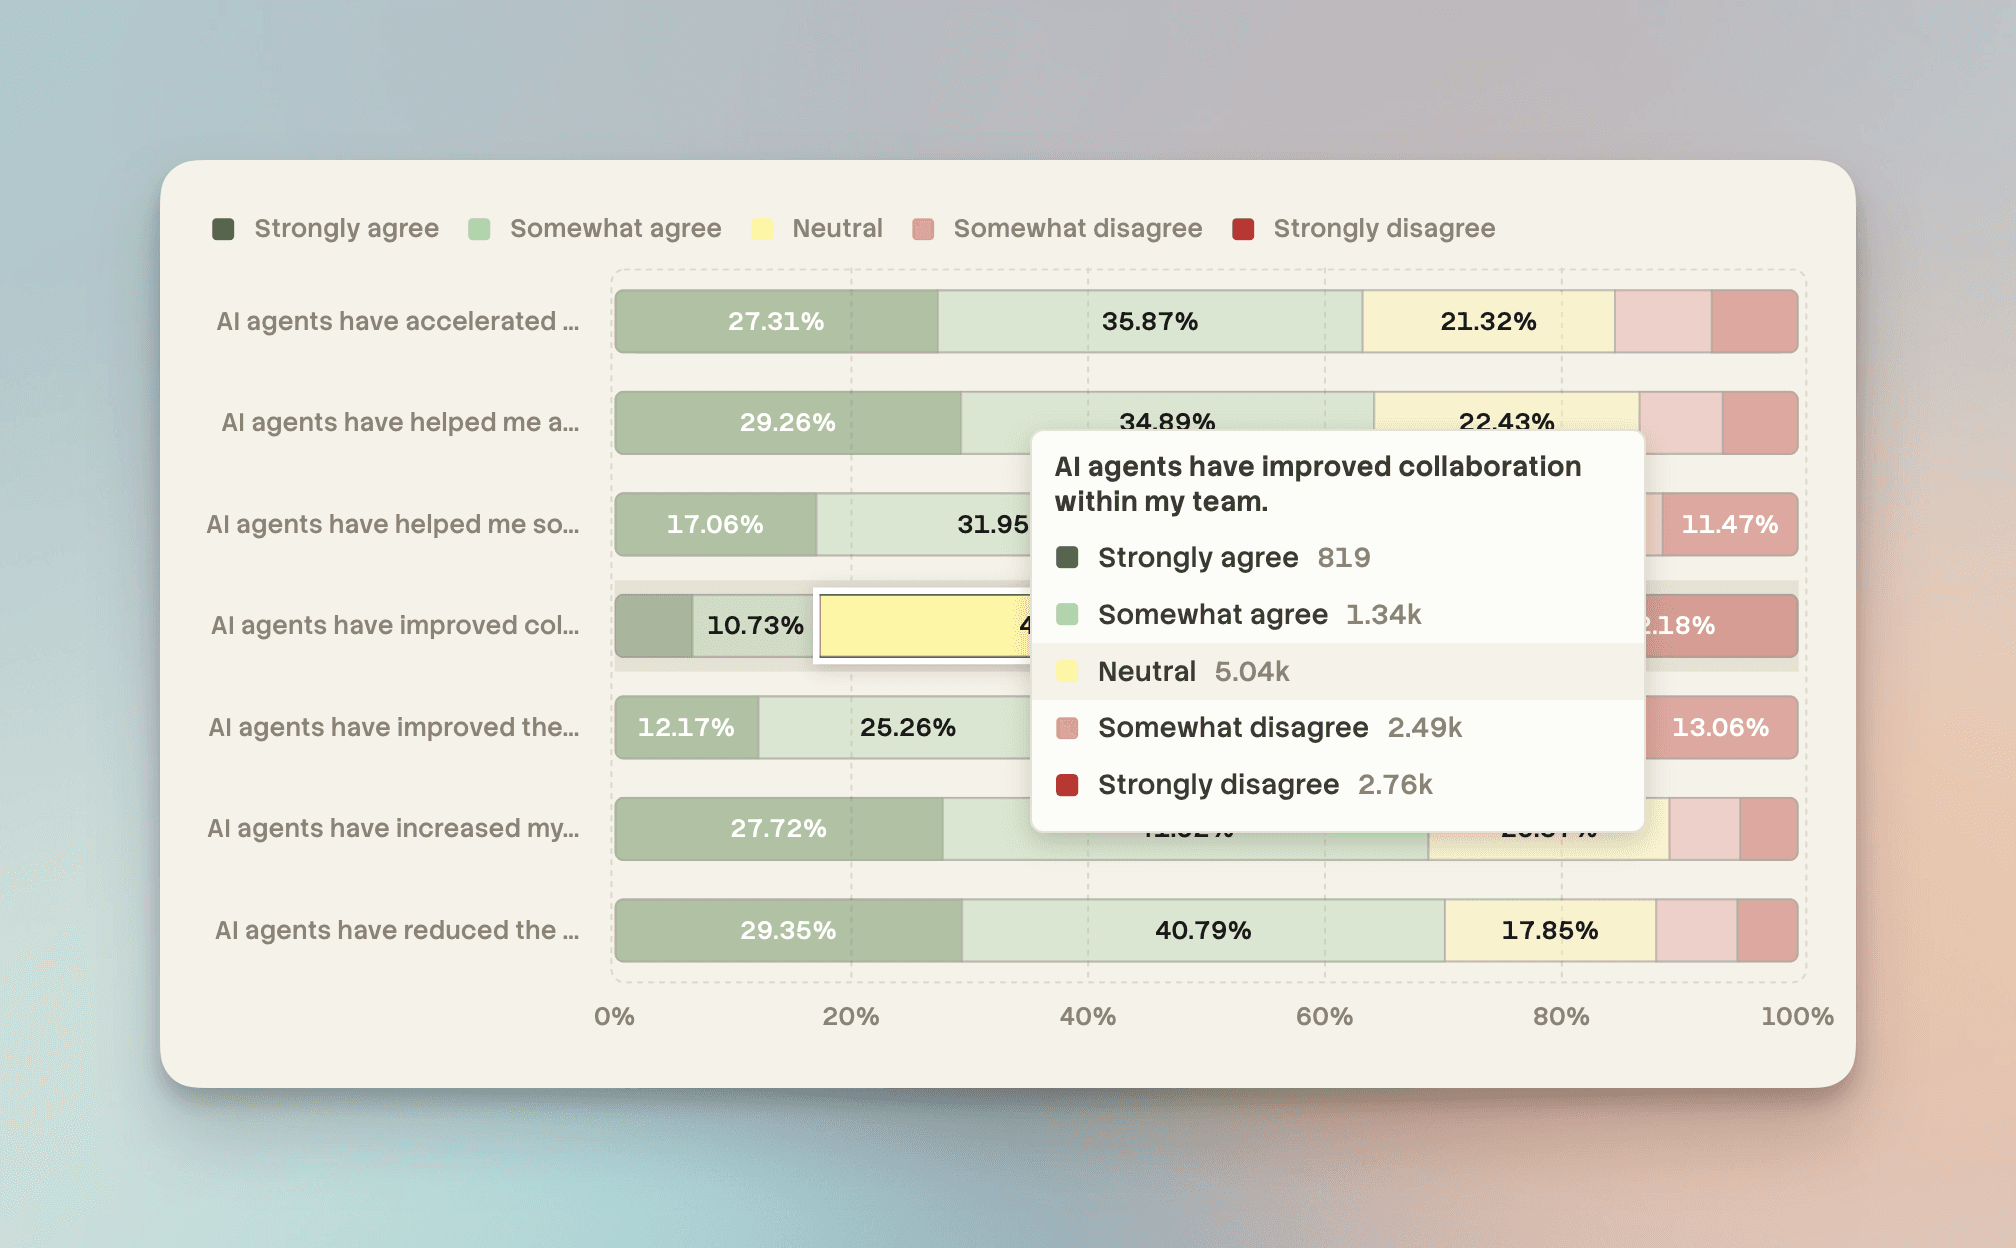
Labels inside a bar or a pie, donut or radial slice now pick black or white to contrast with the fill, so pale colours no longer swallow white text. Set textColor yourself and your choice still applies. A pie or donut label with position: 'auto' moves inside its wedge instead of disappearing when the pie fills the panel.
Bars handle tight fits better too. On a horizontal graph with bars side by side, a label taller than its bar steps outside rather than vanishing and only goes when there is no room outside either. Inside labels that overflow a thin bar keep their inside styling instead of switching to an outside pill, while a label that cannot fit its segment along the value axis is dropped rather than spilling onto its neighbour. Labels also no longer shrink the bars to make room for themselves.
@graphysdk/react is now the only package you need. It includes the spec builders alongside the renderer, so your first graph is one install and one import. If you’d rather skip the bundler entirely, the package ships ready-made browser bundles that jsDelivr serves directly. Drop a script tag on a page, point an import map at React and you have a graph with no build step.
Read-only graphs got lighter too. Rendering a graph without the editor no longer pulls the editor into your bundle and the rich-text dependencies behind it are now optional. Install them only when you use the editable entry.
Edit annotations in place
Select a text box, arrow or shape on the graph and a toolbar appears beside it. Text boxes get background colour, text colour, font, size and alignment. Arrows add thickness, line style, arrowheads and the sticker effect to the colour picker, while shapes keep it to colour, opacity and border thickness.
Every annotation now has handles too. Drag a side to resize a text box or shape, or drag an end to redraw an arrow. Pick up a handle and the arrow keys nudge it, and Escape puts it back.
Combo graphs in the editor
Combo joins the graph type picker. Choose it and every series but the last draws as bars, with the last drawn as a line on its own y axis. A new Combo chart appearance section switches the bars between grouped and stacked, or drops them for lines only, and the y-axis section lets you choose between a single and a double axis.
The editing panel now reaches every part of a graph. Switch between column, bar, line, stacked area, scatter, pie and donut, or any of their stacked variants, as one undoable change.
New sections cover graph appearance, the headline number, polar geometry, graph options and the legend’s alignment and style. Bars get a thickness and corner rounding, on round graphs as well as flat ones. Lines and areas get a stroke width, a fill and optional companion points, and point layers get a size. The axis, legend, caption, subtitle, source, title, text size and number format sections have been reworked along the way.
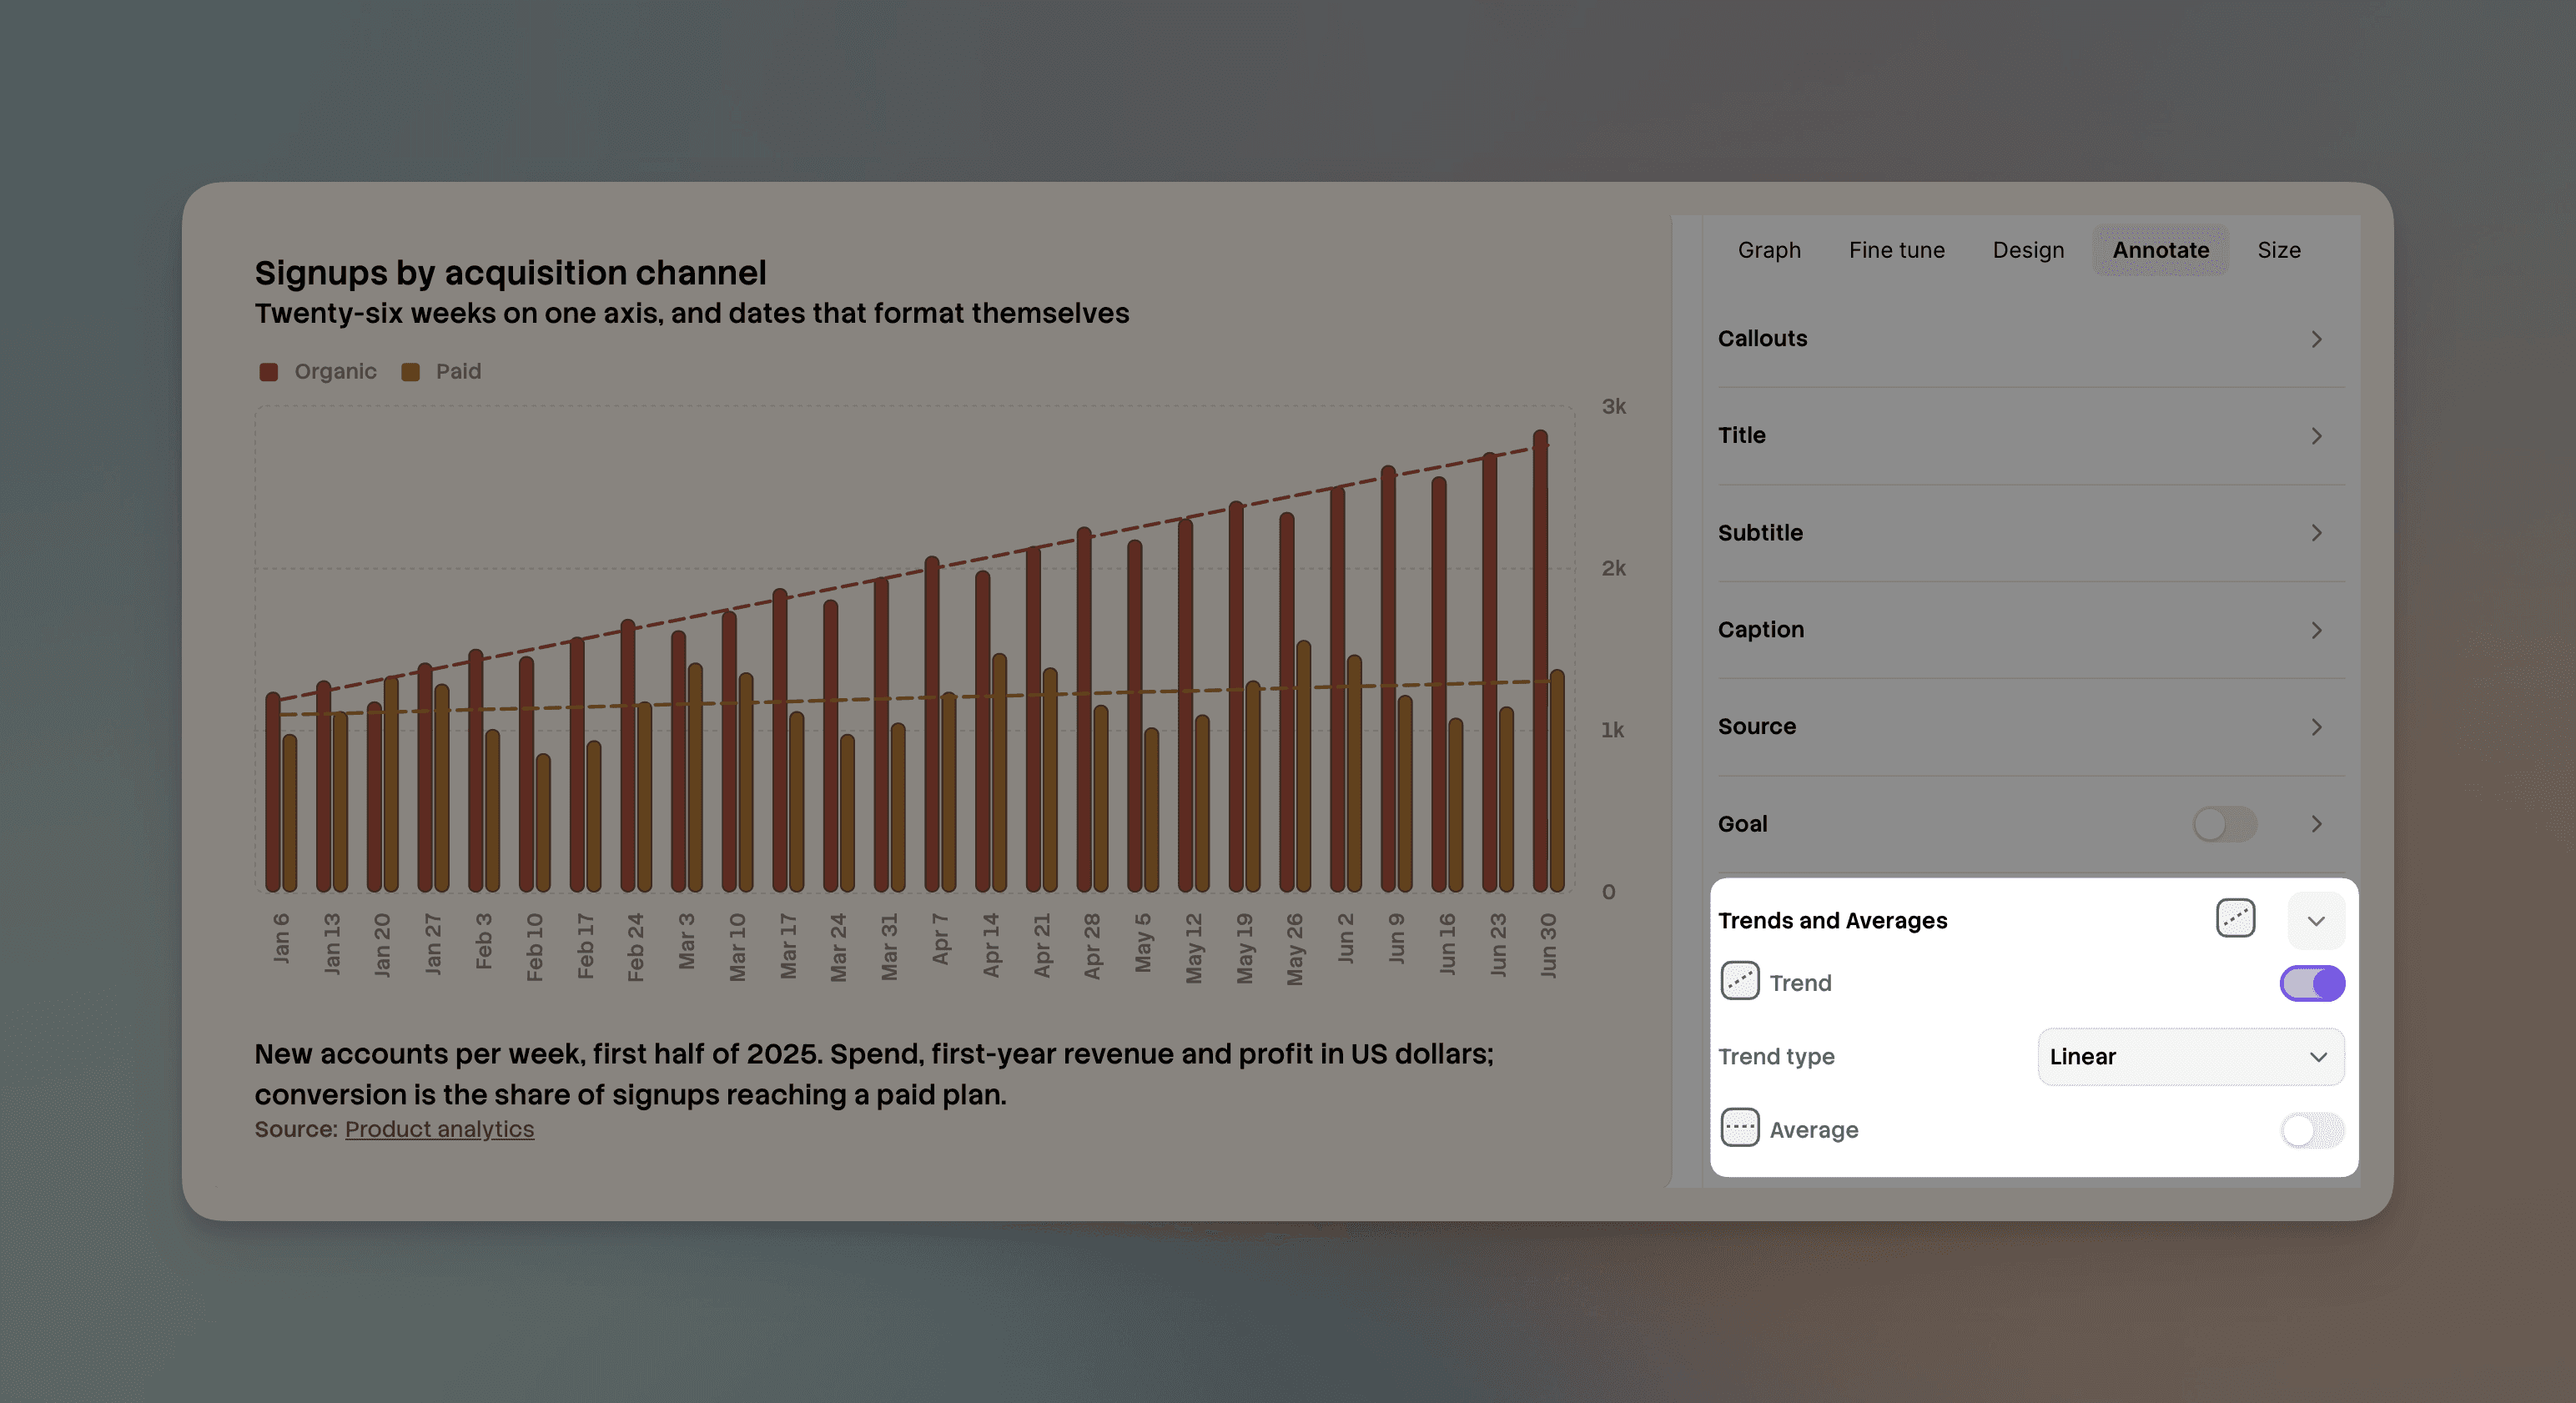
Two more sections bring statistics into the panel. Goal adds a goal line and Trends and averages draws a trend or average line for each series. Both sit on the public ToggleGoalLineCommand and SetStatLineCommand, so the same changes are available from your own code and land in the undo history.
Add callouts from the editing panel
A new Callouts section puts a text box, an arrow, a box or a difference arrow on the graph. Choose a difference arrow and it picks the pair of observations to compare itself.