THE GRAPHY BLOG
Ideas for better data stories.
Practical notes on chart design, embedded data experiences, and the tools that help product teams explain what matters.
Featured image

Data storytelling
6 ways to make a chart more expressive
Six chart design ideas for product teams, from annotations and colour to shapes and interaction, with before-and-after examples built in the Graphy SDK.
Nick Smith
Featured image

Product
Announcing v2 of the Graphy charting SDK
Expressive, highly customisable charts, with storytelling and editing built in. Shaped by hundreds of thousands of charts made with Graphy.app, and ready to build into your apps and AI experiences.
Roman Sîrbu
Featured image
Engineering
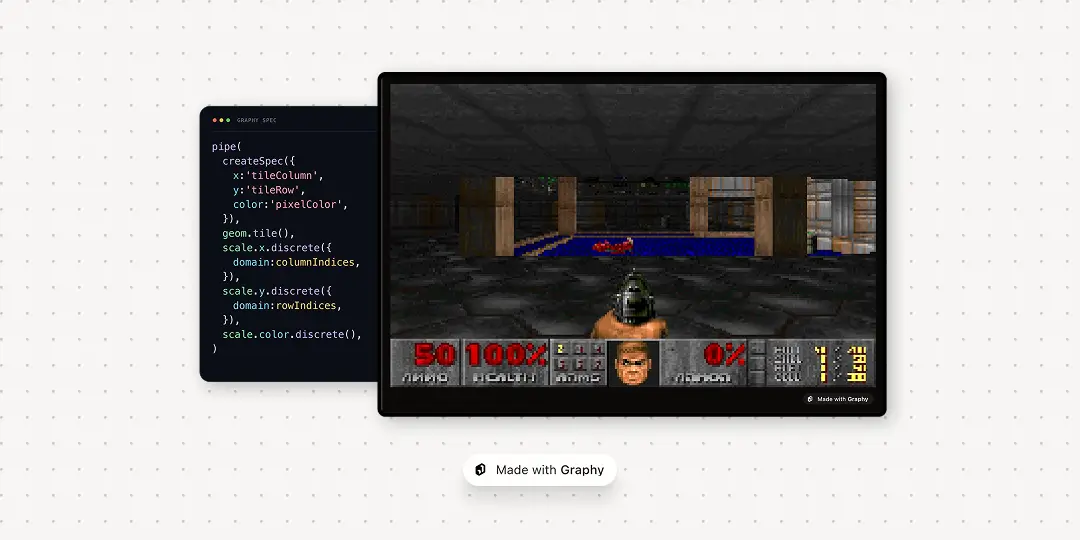
Can Graphy run DOOM?
36,000 rows and a custom SVG renderer: how we turned DOOM into a playable Graphy heatmap.
Jaume Nicolau Prohens
Featured image
Engineering
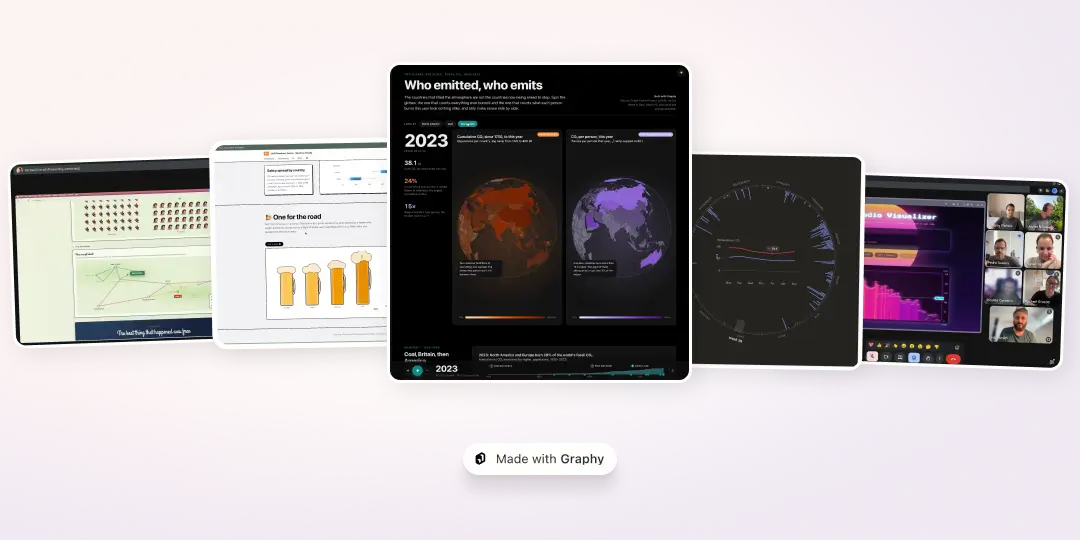
Seven experiments, one SDK: what we built at the Graphy Hackathon
Seven teammates, one Graphy SDK, and a spinning wheel: the interactive tools, reports and micro-products we built in a single afternoon.
Nick Smith