Graphy vs Highcharts: which charting library fits your product?
Compare Graphy and Highcharts for interactive charts, styling, editing and AI. Find the right charting library for your product and the people using it.
9 min read
Featured image
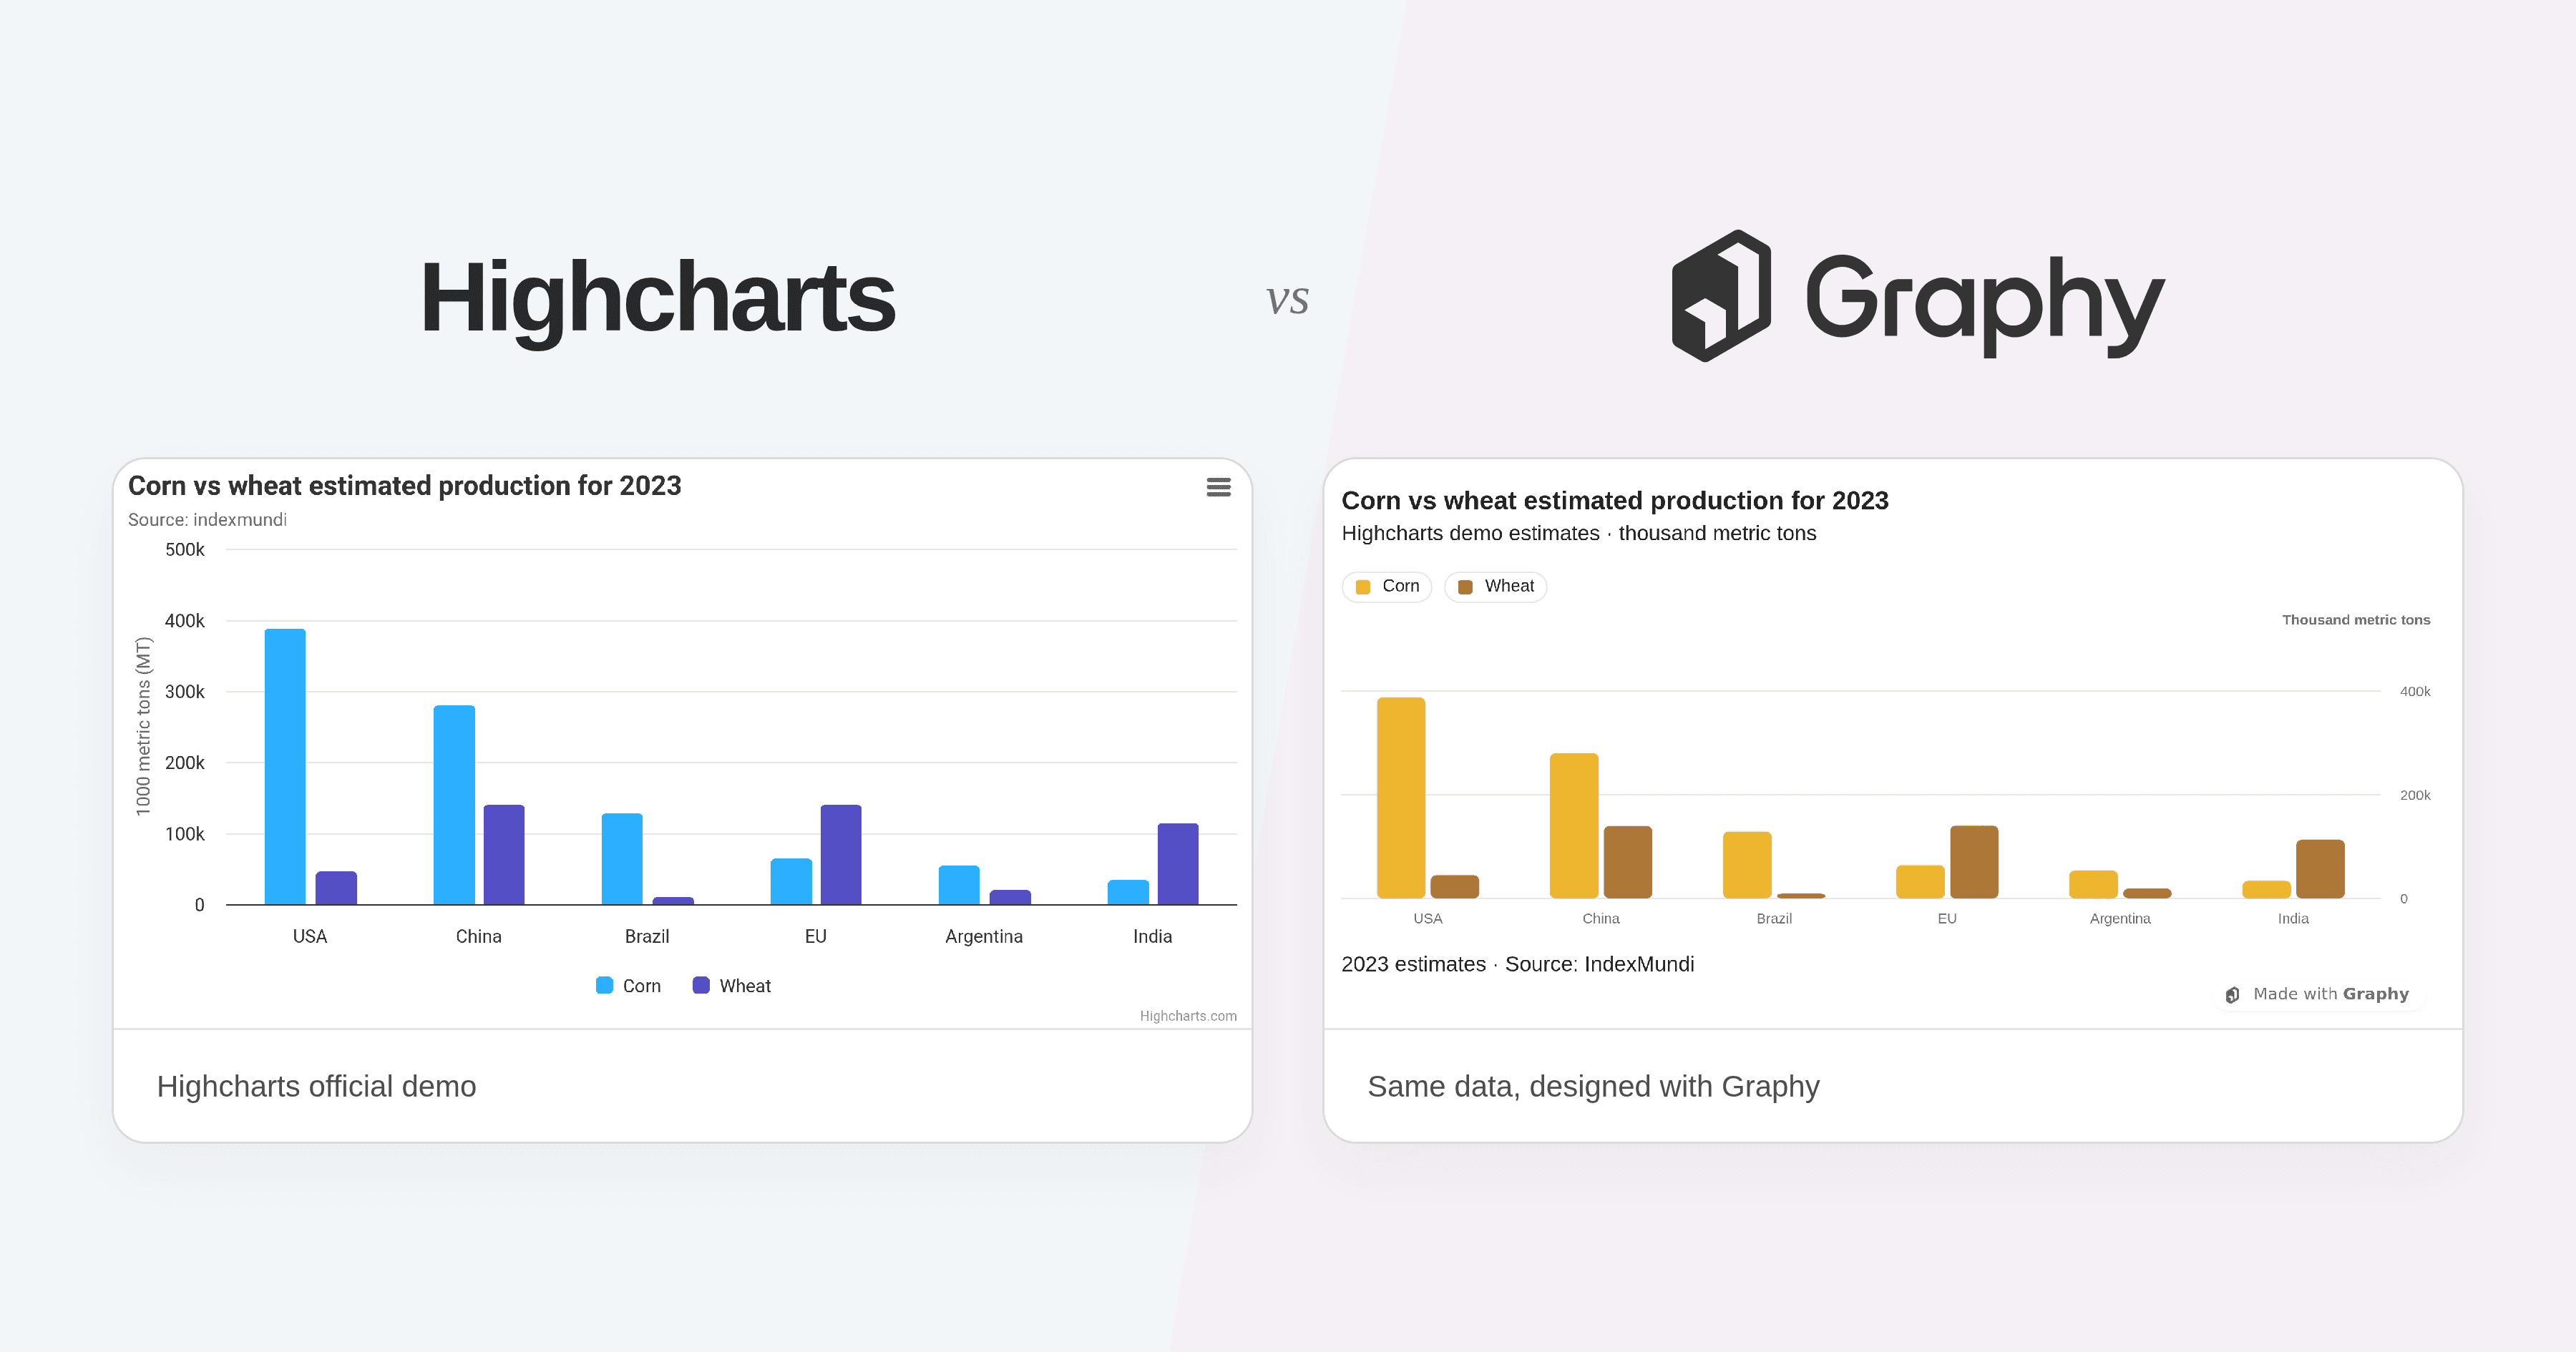
Choosing a JavaScript charting library starts with a few practical questions. Does it support the charts you need? Can you make them look right? Will your users need to edit and annotate their charts? How much work will it take to fit them into your product?
Graphy and Highcharts both let you build interactive charts, customise their appearance and add context with annotations. To choose between them, it helps to look at what you want people to do with those charts, and how much of that experience your team wants to build.
We build Graphy for products where people have something to say with their data. Its focus is expressive design, storytelling and editing: giving users the tools to create charts that feel like their own and communicate what matters. That can mean a chart in a dashboard, a presentation, an article or an AI-generated answer.
So, TL;DR: Start with Graphy when expressive design and user editing are central to the experience you want to build. Start with Highcharts when its specialist financial, mapping or scheduling tools match your requirements. Both support customisation and annotations; the useful comparison is how each helps you deliver the whole experience, including what happens after a chart appears.
Charts that look and feel like your product
Just like the rest of an interface, charts have a visual identity. Typography, colour, spacing and the shapes on the page all influence how they feel. A quiet, precise chart might belong in a financial product; a publication or a personal recap might call for more character.
Graphy gives you room to explore that range. You can build a reusable style for your charts, choose which values deserve emphasis and customise the smaller details that make the whole thing feel considered. Its styling system lets you carry those choices across charts, including fonts, colours, labels, backgrounds and grid lines.
The flexibility extends to the chart itself. Graphy uses a grammar of graphics, which means charts are composed from building blocks such as bars, lines, scales and layers. Developers can combine those pieces or extend the engine with custom visuals to make highly creative, unique charts. You can also bring your own tooltip or legend components to match the rest of your interface.


Highcharts offers extensive customisation through chart options, themes and CSS. If you have an established design system, try implementing a representative chart in both. With Graphy, we’d encourage you to explore how much personality and visual range you can give the charts while keeping a consistent style across your product.
Helping people see what matters
A chart can show every value accurately and still leave the reader wondering where to look. A title that states the takeaway, a highlighted series or a note beside an unusual result can make it much easier to follow.
For example, “Monthly revenue” tells you what a chart contains. “June was our first month above target”, supported by a target line and a note on June, gives you a result to examine. The data stays visible, with enough context to understand the point being made.
Here is the same idea applied to Highcharts’ monthly-temperature demo. Both charts use the same values; Graphy’s headline and difference annotation draw attention to the gap between the July peaks.


This is central to how we think about Graphy. We want people to have the tools to explain their data, whether they’re exploring it themselves or presenting it to someone else. Annotations, highlights and reference lines support that work. Difference arrows can calculate and label a change between comparable values, and data-anchored notes can stay attached to the observations they describe.
Highcharts also has an annotations module for labels and shapes. Graphy’s focus is on bringing those storytelling choices into the same experience as designing and editing a chart, so end users can keep shaping both its appearance and its message themselves.
How much of the editing experience will you need to build?
Some products only need to display charts. In others, people need to change them: rename a title, highlight a result, move a note or try a different visual treatment.
Highcharts provides tools for building an annotation interface. Its custom-GUI guide walks developers through creating controls and dialogs, tracking the selected annotation and connecting a save action to a chart update. Those are useful building blocks, but the surrounding interaction still needs to become part of your product.
The challenge extends beyond developer configuration. In its introduction to Highsoft Lab, Highcharts described the older editor’s advanced-options screen as overwhelming for people unfamiliar with its API. Its experimental successor adds prompt-based customisation and undo. That is a useful reminder to test editing with the people who will actually use it.
Graphy includes editable chart interactions and ready-made editing components, and you can build your own controls to suit your interface. The supplied settings panel covers a subset of chart options; the underlying API gives developers further control.
Those controls use a shared command system to update the chart. Edits from your toolbar, supported interactions on the chart and an agent can share the same undo and redo history. Your app can save the resulting chart configuration and load it again later.
That gives you a foundation for an editing experience where people can experiment, change their mind and return to their work. Your team still decides how the controls fit together and how charts are stored in your product.
Highcharts also offers a separate wizard-style Editor. Its newer Orbit beta brings annotation, analysis, AI assistance and sharing into a toolbar around existing charts.
Try the same editing workflow in Graphy and your preferred Highcharts setup: add a note to a data point, change its appearance, undo the change, then save and reopen the chart. For developers, this reveals what the SDK handles and what the application owns. For product managers, it shows whether users can finish the task comfortably.
From an AI-generated chart to something people can refine
AI adds another way to create a chart, but people still need room to make it their own. They may want to focus on a different comparison, use their organisation’s visual style or add context that wasn’t in the original data.
Graphy’s optional Agents API supports natural-language chart generation and editing. The result can become part of the same charting experience that users work with directly. You can also use the SDK on its own, without an AI workflow.
For developers, a useful part of that approach is the serializable chart specification: a description of the chart that your app can store as JSON. It includes the chart’s structure, styling, highlights and annotations, so people can continue working on a saved chart. Any custom plugin code stays in your application.
Highcharts’ Assist lets you create and refine charts in a chat. Its MCP servers help agents search documentation, validate chart configurations and produce chart HTML or images. These tools support AI-assisted chart creation and development; Assist also advertises limited API access.
Graphy’s Agents API, currently in alpha, gives your application separate calls for tasks such as transforming data, generating charts, adding annotations and writing titles or captions. For example, you could let a user ask to group sales by month, highlight a spike and suggest a clearer title. The agents return an updated chart configuration your app can render or save. Paired with Graphy’s SDK, this lets you build an interface where users can ask for a change in words, then refine the chart with direct editing controls.
When Graphy may be the better fit
Graphy is worth considering as a Highcharts alternative when chart design, storytelling and user editing are central to your product. That could mean a presentation tool where users explain a result, a publishing platform where charts need a distinctive visual style, or an analytics product where people annotate findings before sharing them.
It is especially relevant when you want users to shape the chart themselves: adjust its appearance, highlight a comparison, add context and undo an edit. Graphy’s styling, annotations and shared command system give developers a foundation for those interactions, with control over how they fit into the surrounding interface.
Graphy’s SDK powering the chart building and editing experience in Gamma
The same applies to AI-generated charts that users need to refine. If your product needs to take people from an initial answer to a chart they can edit, save and return to, evaluate Graphy’s SDK alongside its optional Agents API. Your team still owns the application interface and storage.
When Highcharts may be the better fit
Highcharts is worth a close look if your requirements line up with its dedicated Stock, Maps or Gantt products. A financial analysis tool, for example, may benefit from Highcharts Stock’s technical indicators and interaction toolbar.
It also has a documented accessibility module with keyboard navigation and assistive-technology support, and a Boost renderer for supported chart types with large datasets. Boost has feature trade-offs, so test the interactions you need as well as rendering speed.
An existing Highcharts integration is another reason to be specific about what you want to improve. If it already supports your users and your next feature, extending it may be the most sensible decision. A move to Graphy should give you something concrete, such as the editing model or expressive chart experience you want to build.
Graphy vs Highcharts at a glance
What matters most to your product | Where to start |
|---|---|
Expressive charts that users can style, annotate and refine | Graphy brings these capabilities together around a shared chart specification and editing model. |
AI-generated charts that users can continue working on | Evaluate Graphy’s optional Agents API alongside its SDK and editing tools. |
Specialist financial, mapping or scheduling features | Check Highcharts Stock, Maps and Gantt against your requirements. |
An existing charting setup that already works well | Identify the specific user or engineering benefit before changing libraries. |
For either library, use your own data and design in the evaluation. Check the chart types and interactions you need, along with framework compatibility, accessibility, exports and licensing. Graphy’s documentation marks some newer chart types and packaged themes as beta, so check the status of the capabilities you plan to use.
Frequently asked questions
Can users edit and annotate charts with Highcharts?
Yes. Highcharts has annotations, tools for custom editing interfaces, a separate Editor and the newer Orbit beta. Graphy is worth comparing when you want expressive styling and direct editing built around a shared command system. Test the controls and workflow your users need, rather than treating editing as a yes-or-no feature.
Does Graphy include undo and redo?
Yes. Graphy’s command system provides undo and redo for command-driven edits. Supported chart interactions, your controls and agent edits can share that history. Saving the chart is a separate application responsibility; reopening a saved chart does not automatically restore its previous undo history.
Can I use Graphy without AI?
Yes. You can use the Graphy SDK to render, style, annotate and edit charts without adding an AI workflow. The Agents API is optional. That lets you build direct editing first and add natural-language interactions where they help your users.
Can I replace Highcharts with Graphy?
Yes, assuming you’ve confirmed that Graphy supports the chart types and interactions your product needs (browse a selection of the visualizations we support out of the box here). Plan to adapt your chart configuration and application integration to Graphy’s APIs. Start with one representative chart using your own data, then check styling, editing, accessibility, exports and licensing before committing.
To see whether Graphy fits, build your first chart with the quickstart. Give it your product’s visual style, add the context a reader needs, and try the edits you’d want to put in your users’ hands.
Image

WRITTEN BY
Nick Smith
Graphy team
Nick has 13+ years experience of wrestling with the challenge of how to make data clear and easy to understand. He writes about product, marketing, and all things product marketing.
