Change anything about a graph from the editing panel
The editing panel now reaches every part of a graph. Switch between column, bar, line, stacked area, scatter, pie and donut, or any of their stacked variants, as one undoable change.
New sections cover graph appearance, the headline number, polar geometry, graph options and the legend’s alignment and style. Bars get a thickness and corner rounding, on round graphs as well as flat ones. Lines and areas get a stroke width, a fill and optional companion points, and point layers get a size. The axis, legend, caption, subtitle, source, title, text size and number format sections have been reworked along the way.
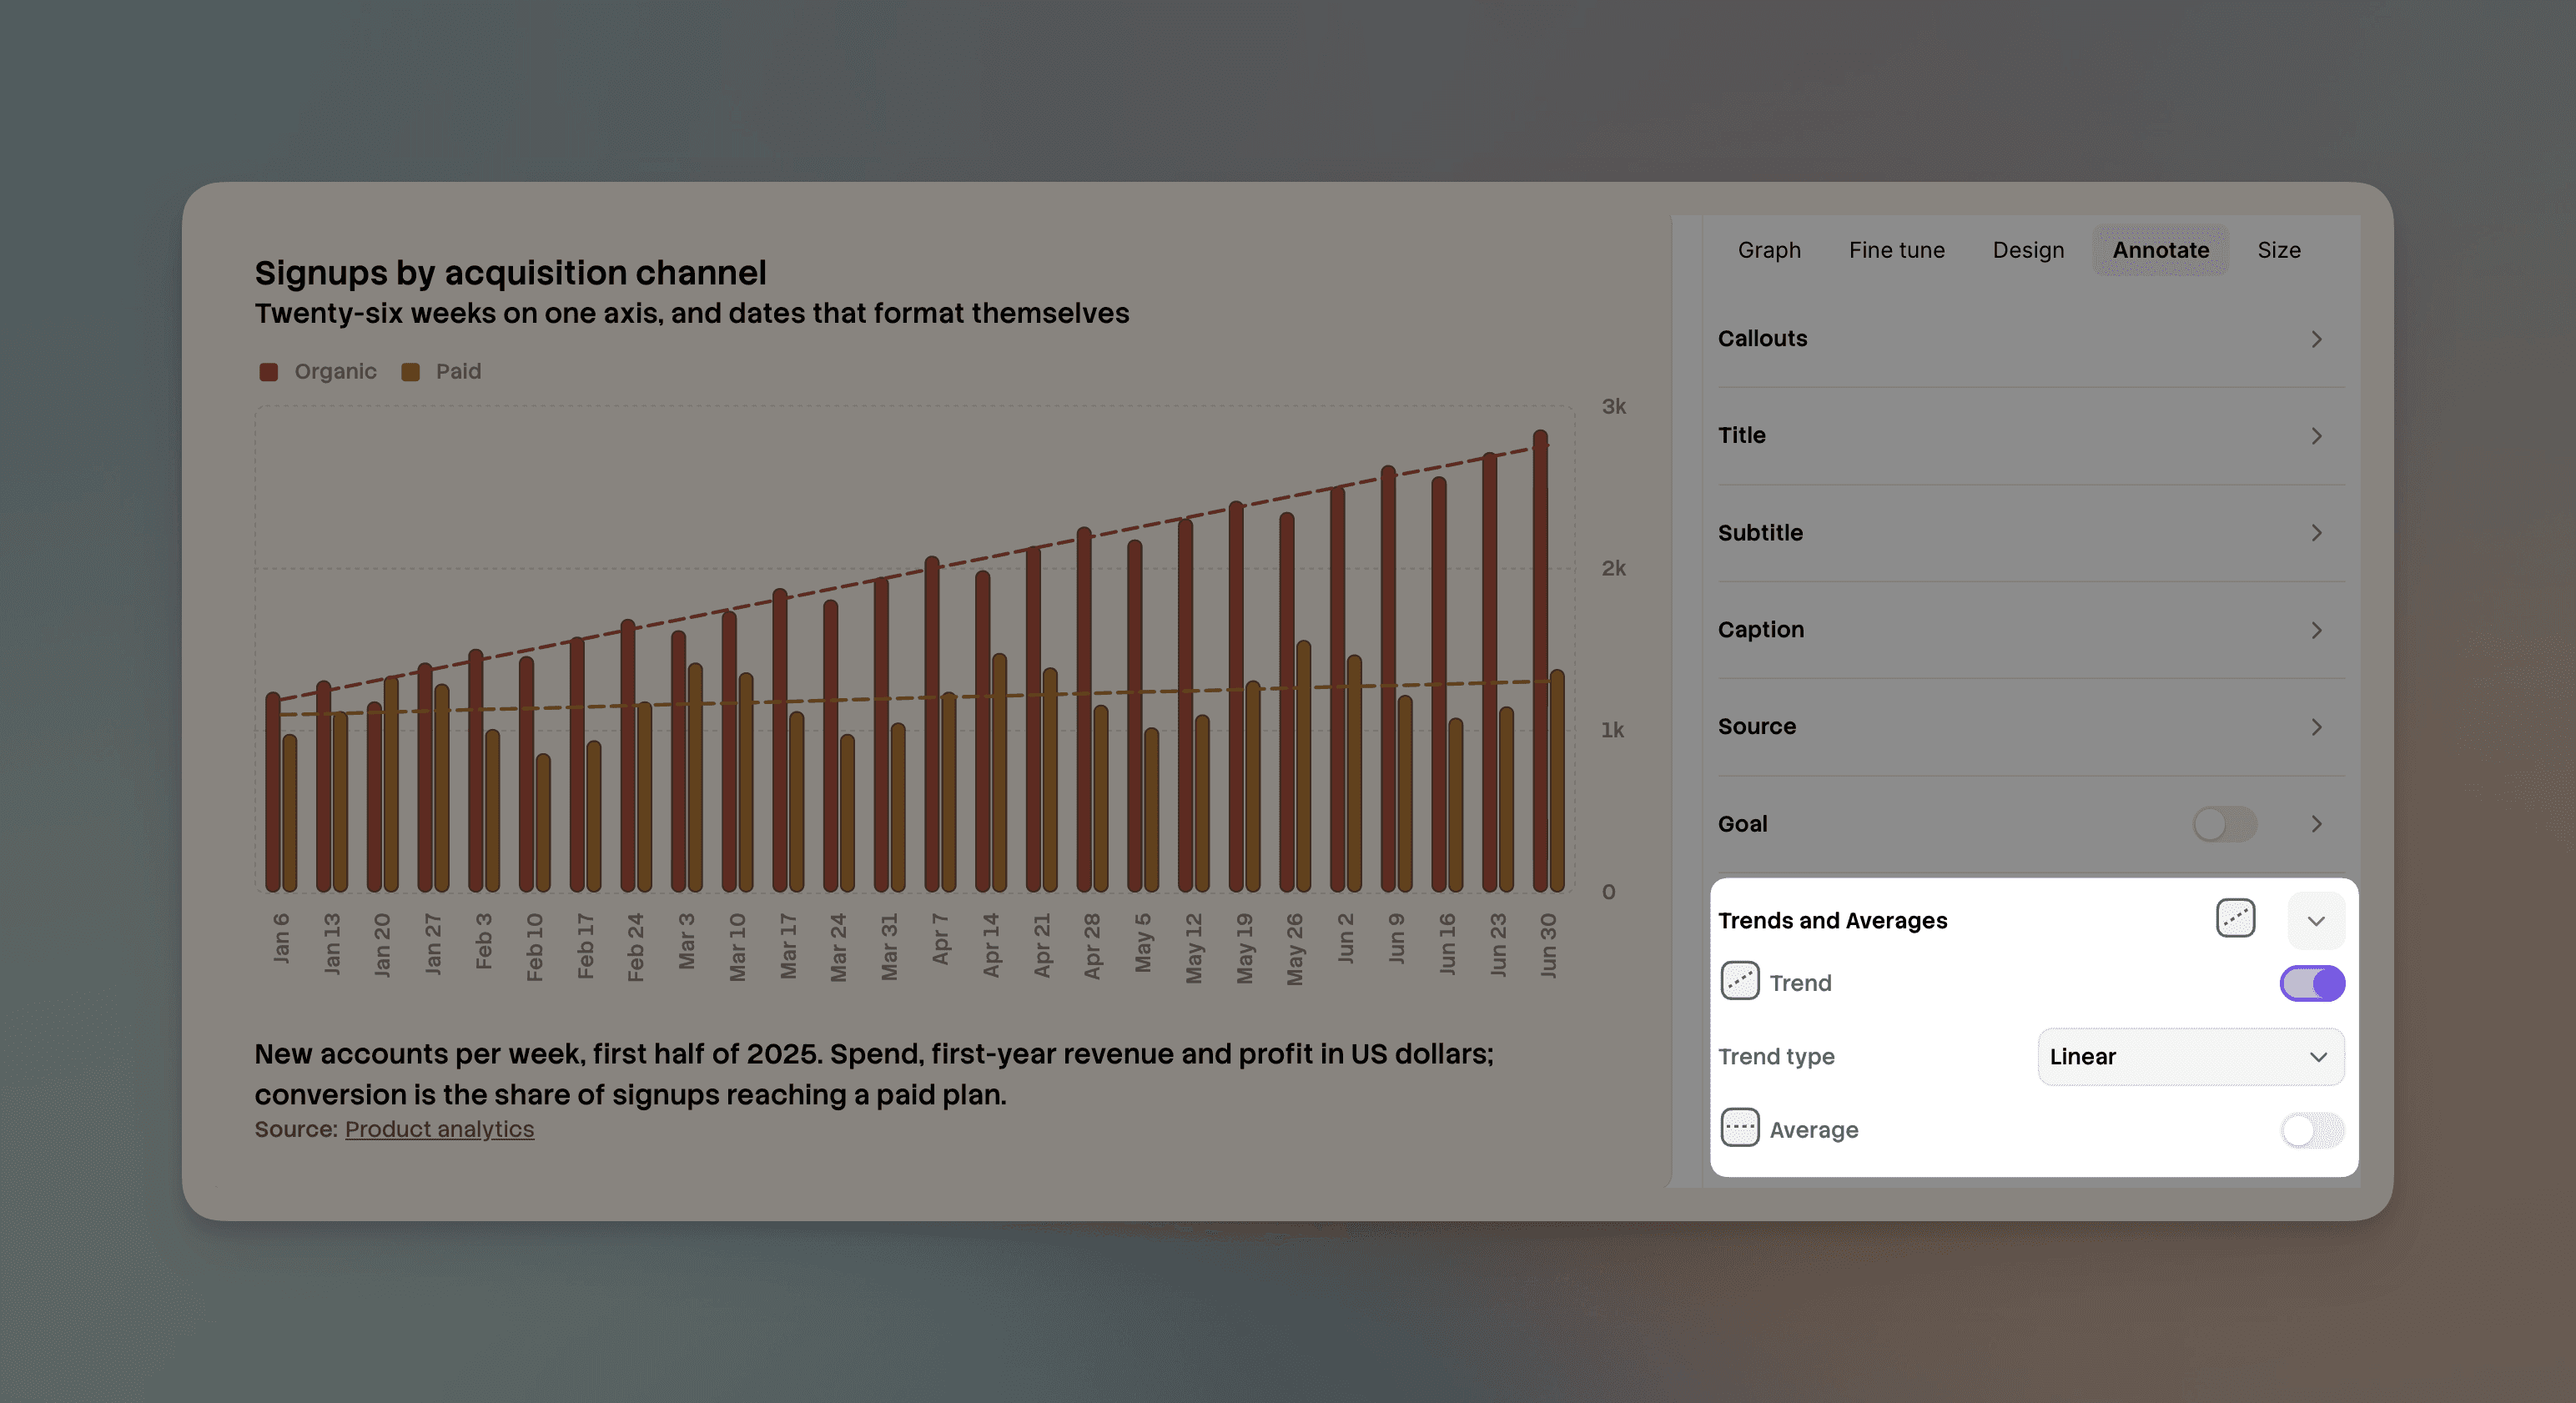
Two more sections bring statistics into the panel. Goal adds a goal line and Trends and averages draws a trend or average line for each series. Both sit on the public ToggleGoalLineCommand and SetStatLineCommand, so the same changes are available from your own code and land in the undo history.
Add callouts from the editing panel
A new Callouts section puts a text box, an arrow, a box or a difference arrow on the graph. Choose a difference arrow and it picks the pair of observations to compare itself.
Style bars, lines, points and slices through the Styling API: each kind has its own vocabulary, and you can add per-layer rules, hovered and dimmed states, colour tokens and
extends, replacing the equivalent params andGraphTheme.Graph chrome is styled the same way: the panel border, grid lines, frame, axis labels, tick labels and tick lines are all targets.
Data labels get their own target in
style.dataLabel, where type, text colour, padding and background are set by role and position.Goal-line labels are styled through the Styling API as well, replacing
fontGoalLineLabel.