Customer story
Why Gamma replaced in-house charting with Graphy

After more than two years building charts in-house, Gamma switched to Graphy’s SDK. Now, Graphy powers the charting in Gamma 5, giving Gamma users more freedom to create expressive presentations, and Gamma’s engineers more time to focus on the core product.
Two years of building a product within a product
Gamma helps people turn ideas into beautifully designed presentations, fast. But for more than two years, its engineering team was also building a charting library.
That brought a whole set of product decisions with it. How should users edit their data? How much control should they have over the design of their charts? How could a chart help someone explain a point clearly, while looking at home in their deck? How should the many edge cases that came up in testing be handled?
Each of those needs carried engineering work. Rendering a chart was just one part of the job; it turned out that editing, customisation and storytelling all needed care too.
For Gamma, keeping that experience up to scratch was a continuing distraction from its main focus: building a better way to create presentations.
A charting experience Gamma could build on
Graphy’s SDK brought together the reliable rendering, polished design and editing tools Gamma needed. The team could bring those capabilities into its product and customise the experience, with much less of the underlying charting work to carry itself.
That mattered as Gamma’s ambitions for presentation design grew. It needed charts with strong defaults and enough flexibility for people to make them their own. Graphy gave the team both, along with tools for explaining the data inside the chart.
The team “never looked back,” says Jon Noronha, Gamma’s co-founder and CPO.

“Graphy is the best library for editable graphs; polished, opinionated in the right ways, and gives users the tools to tell a clear story, not just display numbers.”
Jon Noronha, Co-founder and CPO at Gamma
More freedom to shape the story
Gamma 5 puts expressive presentation building at the centre of the experience. Charts need to offer the same freedom as the rest of the canvas.
With Graphy, people can work on the details that make a chart feel right for their presentation: its colours, text, labels and the way the data is shown. They can change chart types, revise the numbers and add annotations to explain a particular point.
Those choices help the presenter guide attention. An annotation can give a surprising result some context; a well-placed label can make a comparison easier to follow. The chart becomes part of how someone tells their story.

Choosing a Graphy chart type in Gamma
Editable by hand. Connected to Gamma’s AI workflow.
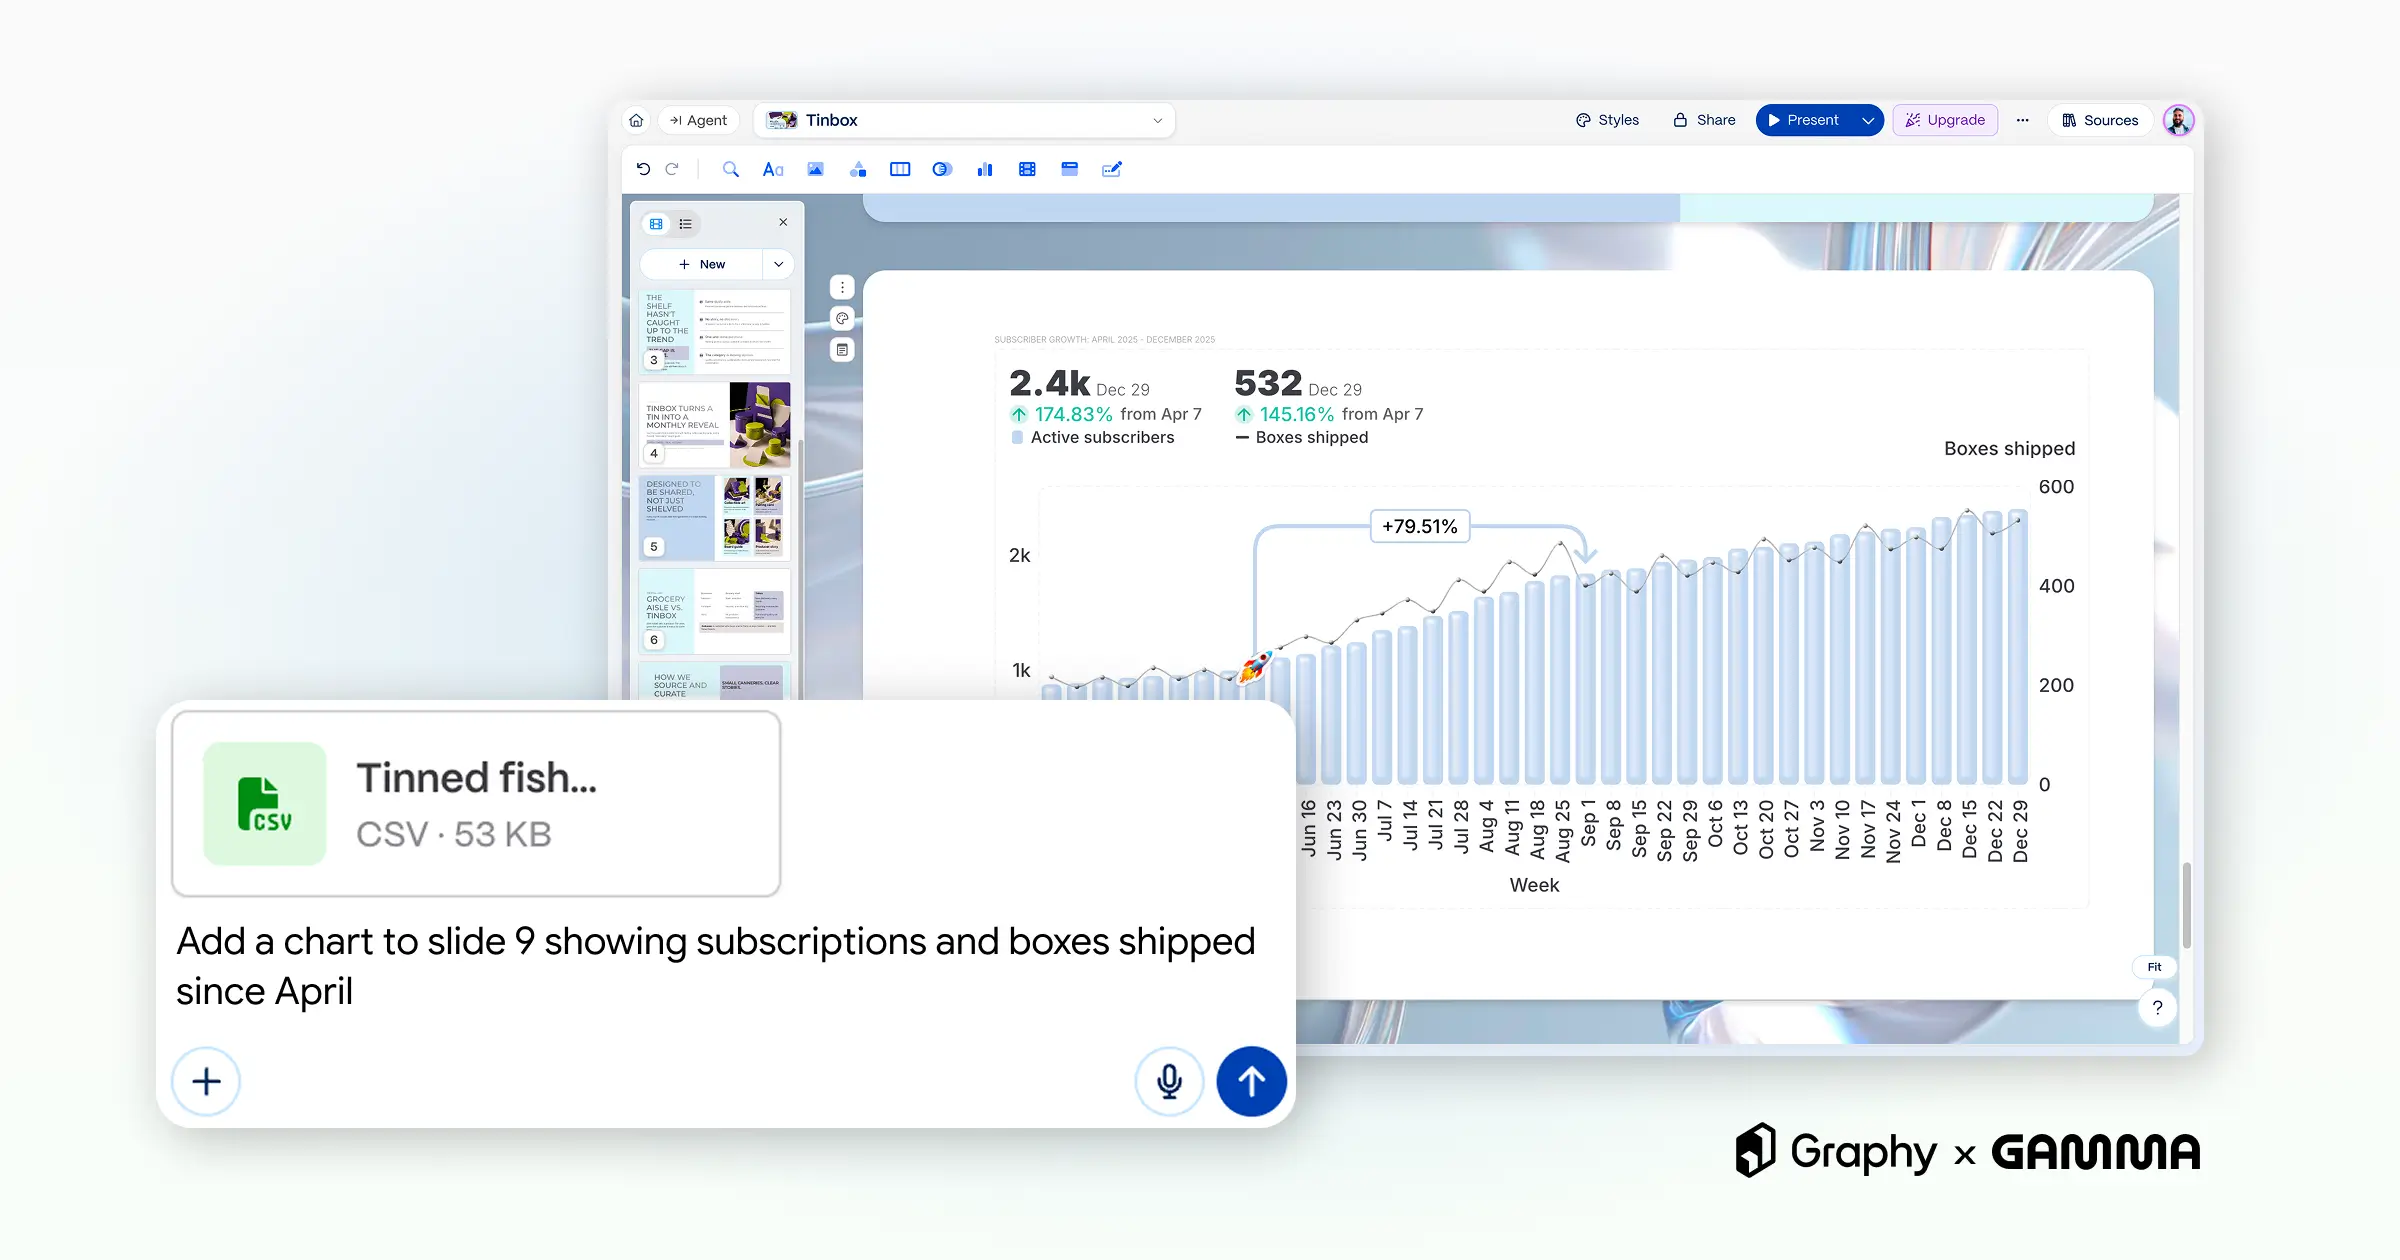
In Gamma’s agentic creation experience, people can ask for changes to a chart as they refine their presentation. They can also open the chart editor and adjust the details directly.
Graphy’s SDK provides the editable charting underneath that experience. Gamma connects it to its own AI workflow, so charts can take part in the same process of prompting, reviewing and refining as the rest of the deck.
For Gamma, that means building on a charting foundation that supports the creative experience it wants to offer. Its engineers can spend more time shaping how people create with Gamma 5, with Graphy handling the chart rendering, customisation and editing tools within it.
Graphy Chart SDK
Add Graphy’s charts to your product
Give your users expressive, editable charts without building and maintaining the charting experience yourself.