Announcing v2 of the Graphy charting SDK
Expressive, highly customisable charts, with storytelling and editing built in. Shaped by hundreds of thousands of charts made with Graphy.app, and ready to build into your apps and AI experiences.
4 min read
Featured image

Building great charts is hard. Trust us, we know.
When we launched graphy.app, our free chart maker, we had a pretty good idea of what people would want. And then they started making charts.
Over time we learnt users wanted more chart types. More control over styling. Better ways to explain a spike in their data. Comparisons. Different ways to make one number stand out…
Every new dataset brought another edge case: a crowded x-axis, a long label, a tooltip that needed to work against a different background. And so on.
Those requests and feedback shaped Graphy, and we’ve spent years working through the details that make a chart clear, useful and attractive enough to put in front of other people.
Today we’re thrilled to be launching v2 of the Graphy charting SDK, packaging all that knowledge up to bring expressive charts, rich storytelling tools and deep customisation to the products you build.
Whether you’re building dashboards, a presentation platform, an AI assistant for on-demand data questions, or tooling for data journalism, your end users can now turn their datasets into something worth sharing.
Created for data storytelling
Why did revenue jump in June? How far are we from the target? Which of these ten lines should I pay attention to? Charts often need context, and the Graphy SDK includes all the tools users need to tell the story.
Highlights draw attention to a point, series or period.
Notes and callouts explain a spike, an outlier or an event.
Difference arrows show the change between two values.
Reference lines and shaded regions add targets, thresholds and context.
Labels and headline numbers make the important values easy to find.
Annotations give commentary around specific data points.
Learn more about Graphy’s annotations and emphasis features
Editing is built in, too. Use the editor that ships with the SDK, or build your own editing experience to fit your product. Editable titles, captions and text annotations, plus chart commands with undo and redo, give your users the freedom to keep refining a chart until it tells the story they want.
See commands and history documentation
Expressiveness at its core
With Graphy, you’re not stuck with the standard line and bar charts everyone is used to. Graphy’s grammar of graphics and plugin system lets you compose a chart from shared building blocks, then customise how those blocks are drawn.
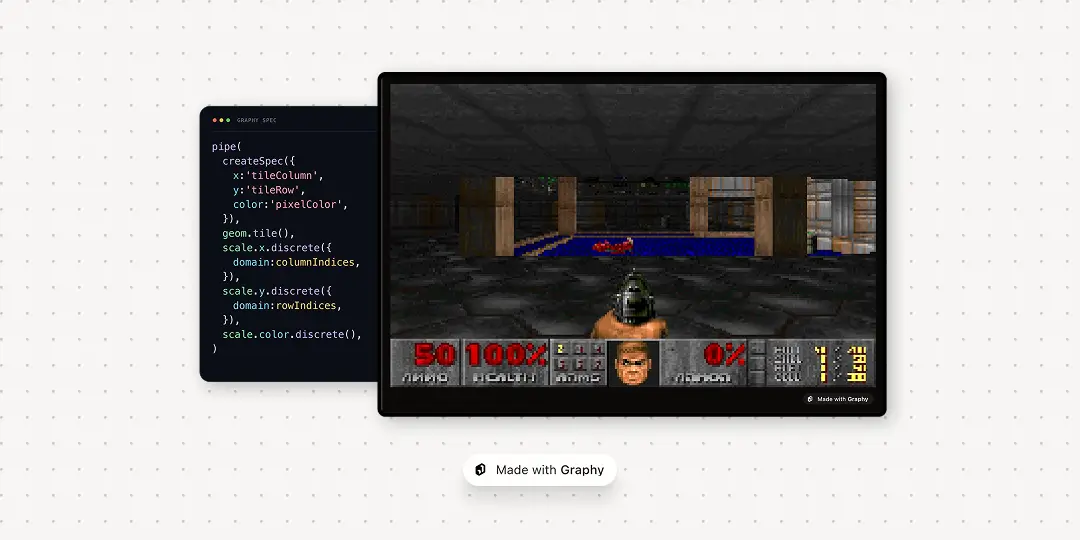
It’s a powerful chart rendering engine that lets you change the composition, combine chart layers and introduce custom visuals, all using the same underlying data. There’s almost no limit to what the engine can render; we even got DOOM running in a heatmap.
Read more about how Graphy builds each chart
Extend it with plugins
Sometimes your product needs a visual that deserves its own implementation.
Graphy’s plugin system lets you add new visual marks, statistics and data transforms. You can also replace how an existing mark is drawn, keeping the engine’s calculations while giving it a different appearance or rendering strategy.
For smaller changes, slots let you supply your own tooltip, legend or header. You can make those parts feel native to your product without forking the charting library.
Built for developers and coding agents
Graphy’s SDK gives you typed TypeScript builders, React components and worked examples to build from. The same documentation gives your coding agent a concrete API and patterns to follow.
A chart’s specification is also serialisable JSON. Your app can store it, send it between services and load it again, including its styling and annotations. Ideal for giving AI workflows a structured chart to generate and revise, and giving your users something they can keep working with.
For example, an AI assistant could create a first chart from a dataset, then your user could refine the title, highlight a result and add the context they want to share. Graphy supplies the charting and editing foundations for that workflow.
Read about chart specifications
Coming next
This is an exciting milestone, but we’re not stopping here. We have an ambitious roadmap to make our SDK as powerful and fun to work with as possible. Over the next few months, look out for a richer Styling API, more plugins, and a new editing experience that makes it easier to shape a chart’s appearance and explore how the data is presented.
We’ll share more about each as it’s ready, and you can follow along on our changelog.
Get started
To get Graphy up and running in your project…
Follow the quickstart to render your first chart, then try it with your own data. You’ll also find examples, API documentation and a link to our Discord community in the SDK docs.
If you’re building with a coding agent, we recommend installing Graphy’s skills for help with SDK setup, chart creation and editing:
Choose your coding agent in the installer, then restart your agent session.
We’re looking forward to seeing what you build!
Image

WRITTEN BY
Roman Sîrbu
Co-founder
Roman is a co-founder of Graphy. He works on the charting SDK, helping developers build expressive charts and editing experiences into their products.