Product
Graphy vs Plotly: which charting library fits your product?
Compare Graphy and Plotly for embedded chart editing, annotations, AI and analytical apps. See integration work, export options and licensing trade-offs.
6 min read
Featured image

When customers create reports or presentations in your product, the chart is often just a starting point. They might want to style it to match their brand, highlight what changed and refine the result before sharing it. Each of those actions needs controls, behaviour and code that your developers will have to maintain.
If you’re considering Graphy as an alternative to Plotly, the question is how much of that editing experience your team wants to build. Graphy is a React charting SDK with built-in editing controls. Its styling, data-aware annotations and shared undo history for supported edits give developers more of the chart-editing experience ready to use.
Plotly.js is a JavaScript charting library with a broader range of analytical chart types, including scientific, 3D and geographic visualisations. Its Python library and Dash also make it a strong option for teams turning analysis into interactive applications. For a report builder, evaluate its editing controls and undo behaviour alongside that analytical range.
This comparison looks at where each library fits, what it provides and the work your team will need to do, from styling and annotations to saving charts and supporting AI edits.
Themes and styling: make charts fit your product
A chart in a customer’s report needs to feel like part of their brand. Both Graphy and Plotly let you customise its appearance and reuse those choices across charts.
Graphy’s theme packages provide coordinated colours, typography and chart styling. You can start with a supplied look, such as the Night theme in the comparison image or Bauhaus in the example below, then override individual details. The same chart specification works across themes, giving your team a way to offer different visual styles without rebuilding the chart.

Plotly’s templates also let you reuse styling and formatting, including your own brand defaults. The comparison image shows Plotly’s default appearance beside a themed Graphy chart; Plotly can be customised too. Graphy’s supplied themes are useful when you want a distinctive starting point and less styling to define yourself.
Embedded chart editing: what will your team need to build?
Graphy’s editable renderer lets users select chart elements and open their editing controls. Its supplied menus apply supported changes through the chart’s command system, so those edits share undo and redo. Your team can customise the menus and add controls for your product.
Plotly’s direct-editing options let users change titles and annotation text, or move annotations, legends and shapes. Drawing tools add lines, rectangles and freeform paths.
For a fuller settings interface, Plotly offers React Chart Editor. It includes a default editor with controls already connected to the chart, plus components for building your own panels. Check its declared version requirements before choosing your stack: the current package declares support for Plotly.js versions below 3.0.
Graphy’s supplied menus and custom controls can share the same command history. As you add controls, you can connect their changes to the same undo and redo flow, so users can undo edits in one place. With either library, you still need to build product-specific controls and connect saving to your application.
Annotations: help users explain what changed
A monthly report often needs to explain a result: mark a campaign launch, highlight a period or show how much revenue changed.
Graphy’s annotations include notes attached to data points, shaded regions and difference arrows. A difference arrow calculates and labels the change between comparable data points. That gives your team a way to show a calculated comparison without building the calculation and arrow layout yourself.
In the example above, paid accounts rise from 120 in January to 270 in June. Graphy calculates the +125% label on the difference arrow. The separate note points out when accounts first pass 200.
Plotly also supports text and arrow annotations. To show the same percentage change, your code supplies the calculation, label and coordinates, then updates the label when the values change. Graphy’s difference arrow handles that calculation and label for you.
AI editing and undo: let users refine changes
A customer should be able to try a new style, move a note and undo a mistake. Graphy’s supported edits share one command history, so each control can use the same undo and redo system.
Users need the same freedom to revise a change made by an AI assistant. When your application validates a request and applies it through a supported Graphy command, that change joins the same undo history as a manual edit. The user can keep editing the chart or undo the change through the editor.
Plotly.js has undo/redo history, disabled by default. Your team needs to enable it, provide controls and check which edits it covers. An assistant can generate or update Plotly configurations too; you then need to connect those changes to your chosen editor and history.
Graphy’s separate Agents API is in alpha. Check its output against your SDK version before promising a complete generate-and-edit experience.
Saving charts: what does your application own?
When someone comes back to a report, they expect to find their changes saved. Both libraries give your application a way to capture chart changes: Graphy through a configuration callback, and Plotly through its React wrapper callbacks. Your application still handles storage, permissions and collaboration.
With Graphy, save the chart configuration alongside its data and the theme or plugins it needs. That lets you reopen the chart, but it does not restore the previous undo history.
Choose Plotly for specialist analysis and Python workflows
Plotly is a natural starting point if users need scientific visualisations, geographic charts or 3D surfaces and meshes. Its range of specialist charts can be a stronger match for those requirements.
If your team already uses Plotly to analyse data in Python notebooks, it can reuse those charts in a Dash web application. That gives other people a way to interact with the analysis through a dashboard. For teams working in JavaScript or React, Plotly.js also runs without a Python backend.
Performance: test the charts your users will build
Compare both libraries using realistic data, styling and annotations on your target devices. Measure the initial render, data updates and responsiveness while editing. For a report builder, include several charts on the same page. A fast first render alone won’t tell you how the finished product feels.
Licensing and exports: what will you pay for and build?
Plotly.js is MIT-licensed, with no chart-library licence fee. Your budget still needs to cover the editor integration and maintenance your product requires. Commercial products such as Dash Enterprise have separate terms.
Graphy provides free licences for qualifying noncommercial and small-business use. Teams outside those grants can evaluate it locally or internally for 32 days, but need a commercial licence to ship it in a public product. Compare the applicable licence cost with the controls and editing behaviour your team would otherwise build.
Plotly.js supports PNG, JPEG, WebP and SVG exports, though SVGs containing WebGL charts include raster images. Graphy does not currently support SVG export. If supported SVG export is a requirement, that is a reason to favour Plotly.
For either library, test the finished charts and controls with the keyboard and assistive technologies your users rely on.
Where each library fits
Choose Graphy when customers need to create and refine charts inside your report or presentation builder. Its editing controls, calculated annotations and shared undo history give your team more of that experience ready to use.
Choose Plotly when specialist visualisations or your team’s existing Python analysis are the priority. If customers also need an editor, include the work of integrating it in your evaluation.
Your product needs… | Where to start |
|---|---|
Let users edit charts inside your product | Graphy, for supplied editing controls and shared undo/redo. |
Show a calculated change between values | Graphy’s difference arrows. |
Undo manual and AI edits together | Graphy, when edits use its supported commands. |
Scientific, 3D or geographic charts | Plotly’s specialist chart types. |
Python analysis turned into an application | Plotly and Dash. |
Supported SVG export | Plotly; check raster content in WebGL exports. |
A permissive open-source licence | Plotly.js and its MIT terms. |
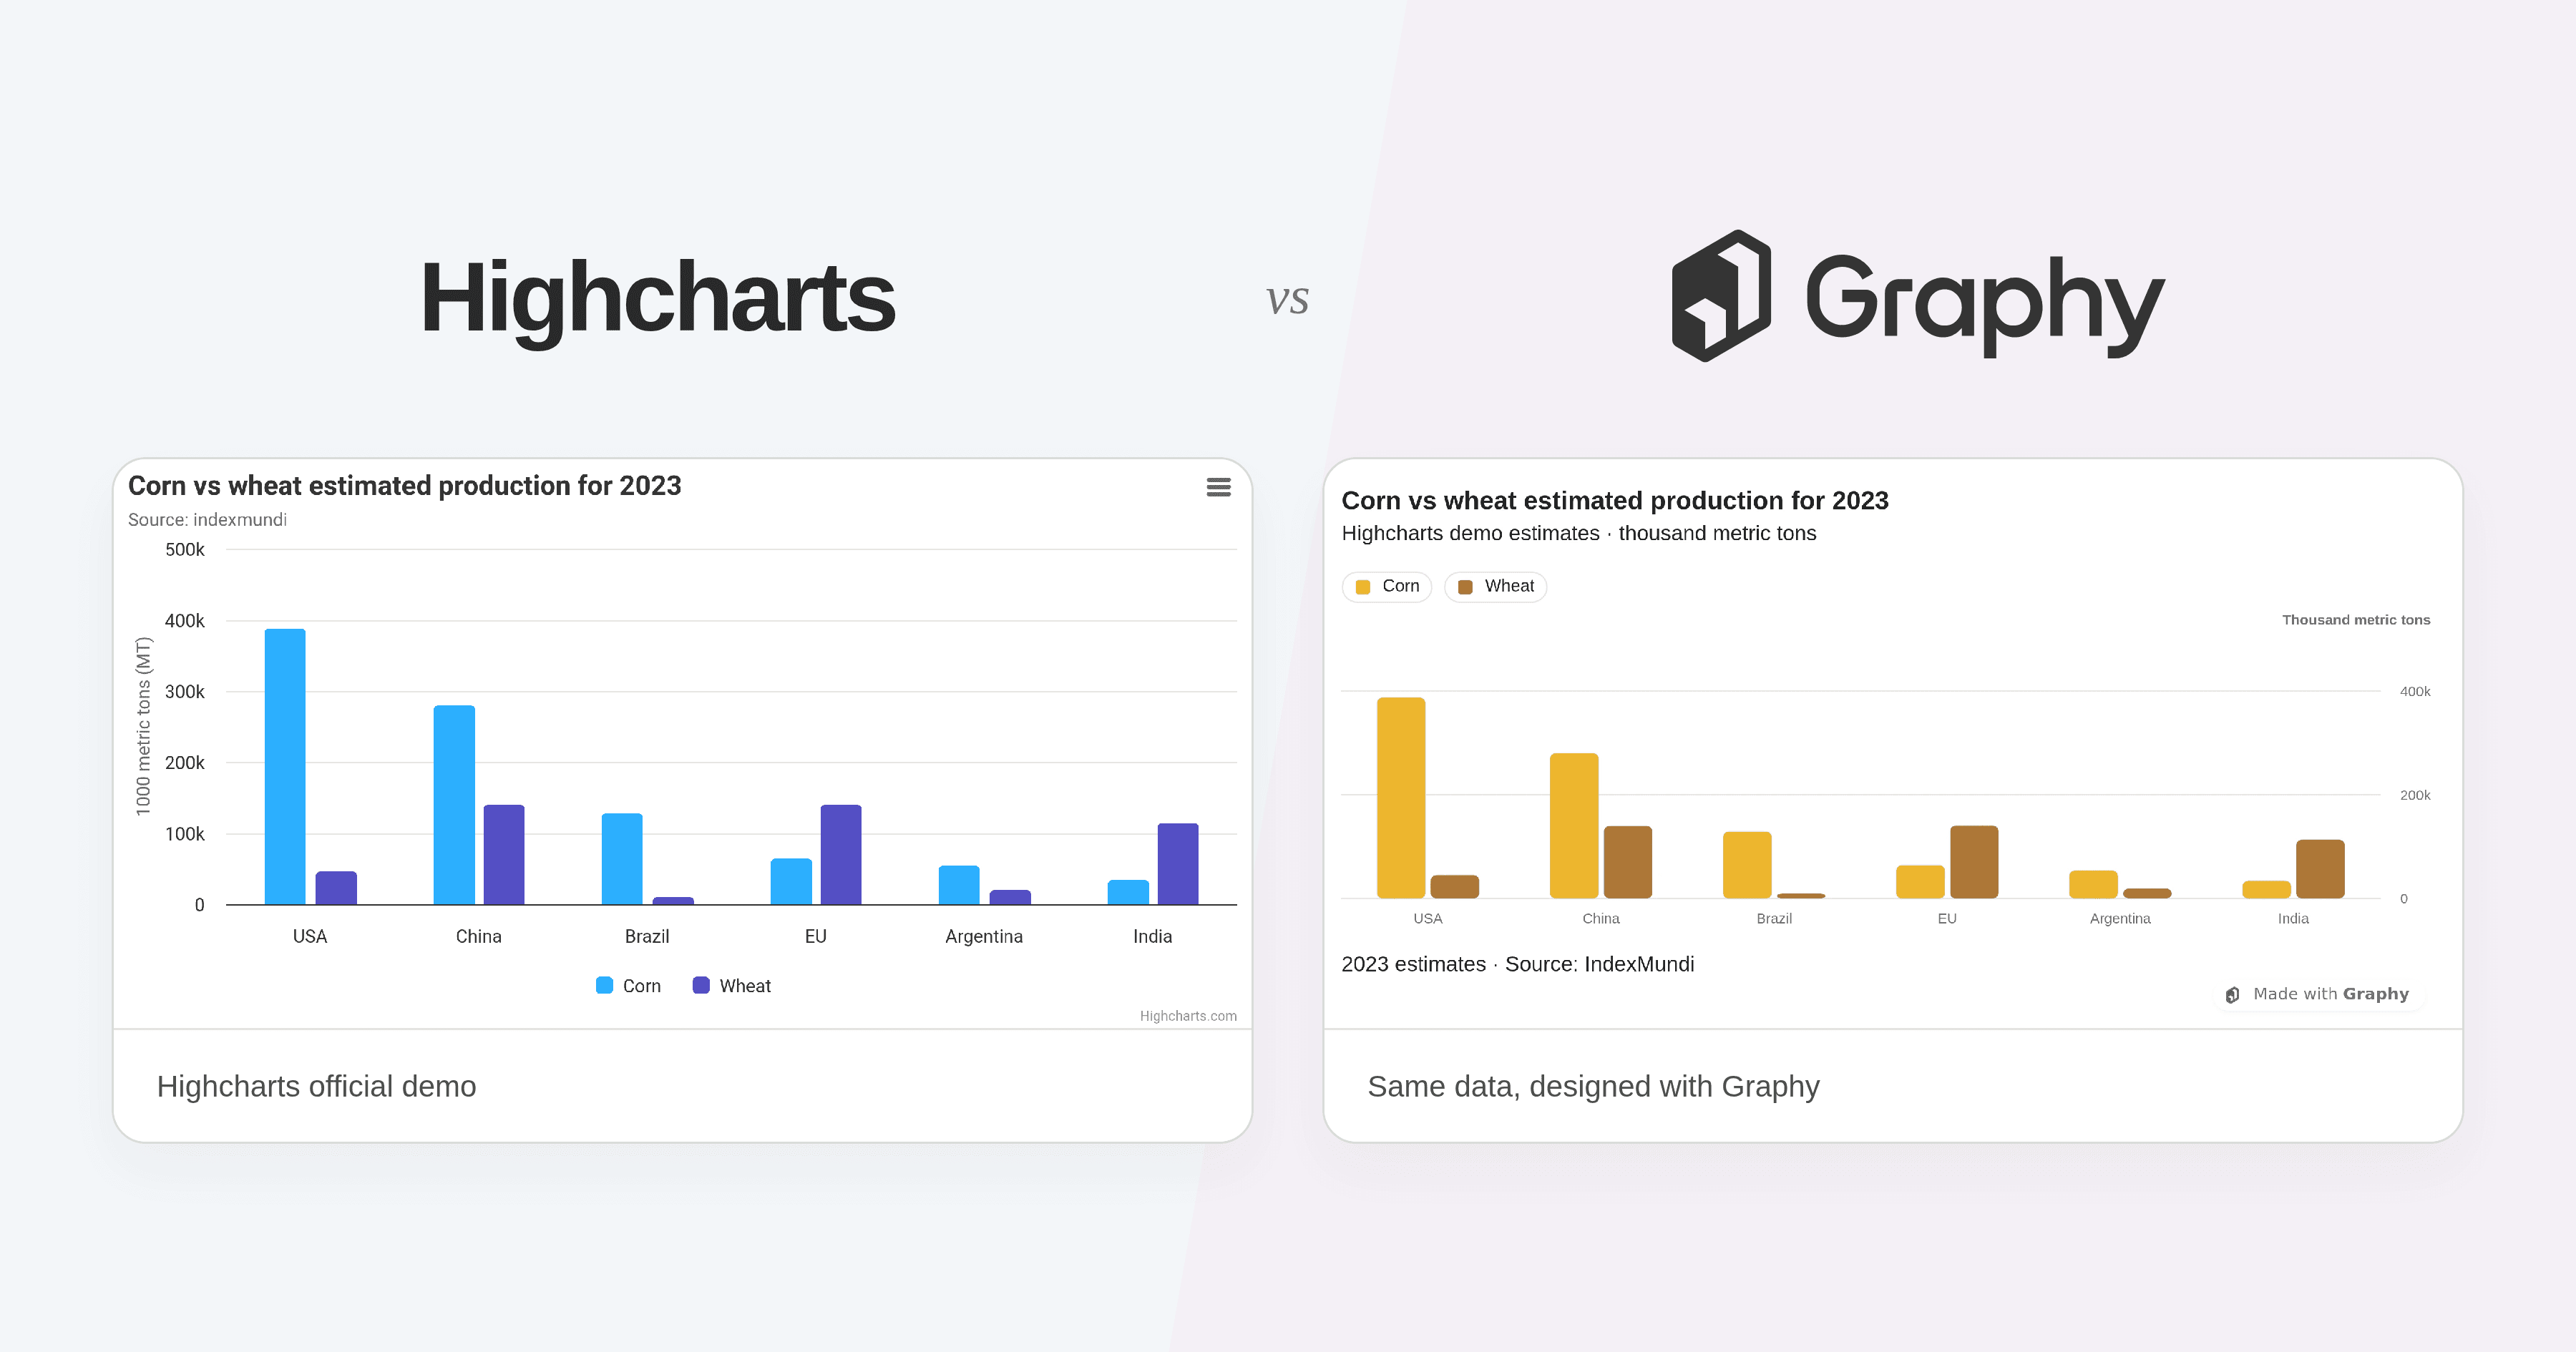
Explore Graphy’s chart examples or get started with the SDK. If you’re comparing other chart libraries, read Graphy vs ECharts and Graphy vs Highcharts.
Image

WRITTEN BY
Nick Smith
Graphy team
Nick has 13+ years experience of wrestling with the challenge of how to make data clear and easy to understand. He writes about product, marketing, and all things product marketing.
Install and test it on your own machine.
01 install
Add Graphy to your app
npm install @graphysdk/react
02 render
Render your first chart
<GraphProvider input={spec} data={data}>
  <GraphRenderer />
</GraphProvider>
03 go live
Use Graphy in production.
Tell us what you are building. We will help with the right licence, integration path and support.